
Eli Lilly And Co. (NYSE: LLY) stock experienced significant selling pressure on Thursday, June 27th, closing the trading session with a notable loss. This analysis delves into the day’s performance based on the latest market data, providing key insights for traders and investors looking ahead to the next trading day.
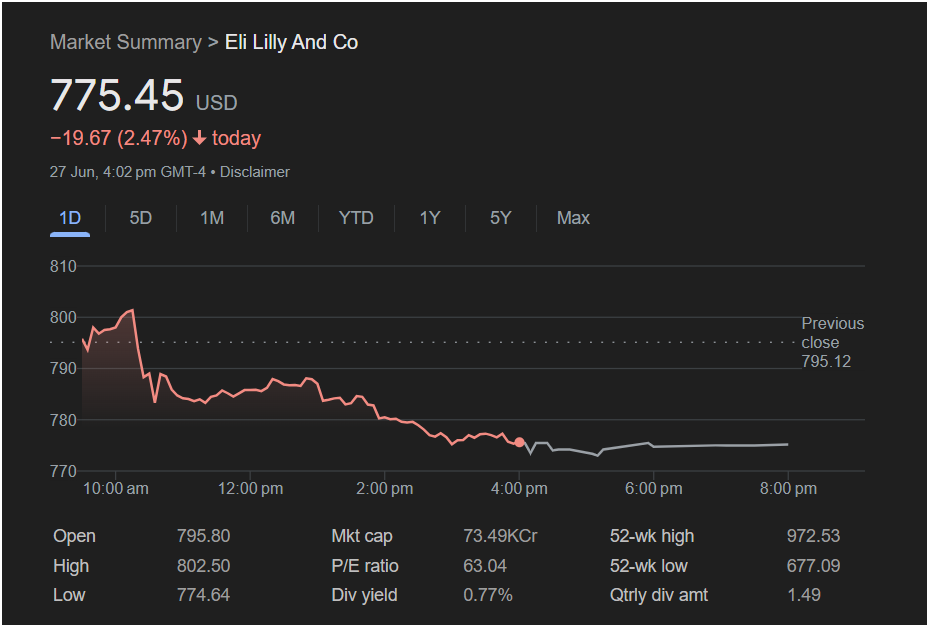
The pharmaceutical giant closed the day at 775.45 USD, down 19.67 USD or 2.47%. The drop erased early-session gains and left the stock near its daily low, signaling a bearish sentiment heading into the close.
The Day’s Trading Story
A look at the intraday chart reveals a volatile session for Eli Lilly stock. The stock opened at 795.80, just above its previous close of 795.12. Early optimism quickly pushed the price to a daily high of 802.50. However, sellers took firm control shortly after, initiating a sharp decline that continued for most of the day. The stock eventually found a bottom at 774.64 before stabilizing and trading sideways in the final hours of the session. This price action, characterized by a failure to hold early gains and a close near the day’s low, is a pattern traders will be watching closely.
Key Financial Metrics at a Glance
For any trader, understanding the full picture is crucial. Here are the vital statistics from the close on June 27th:
-
Closing Price: 775.45 USD
-
Day’s Range: 774.64 (Low) – 802.50 (High)
-
Previous Close: 795.12
-
Market Cap: Approximately 735 Billion USD (Note: 73.49KCr is a notation equivalent to 7.349 Trillion INR)
-
P/E Ratio: 63.04 (This high ratio indicates that investors have strong growth expectations for the company)
-
Dividend Yield: 0.77%
-
52-Week Range: 677.09 – 972.53
-
Quarterly Dividend: 1.49 USD
Will The Stock Go Up or Down? What to Watch on Monday
Based on Thursday’s trading data, the immediate outlook warrants caution. Here’s what traders should be monitoring:
-
Key Support Level: The stock found temporary stability around the
775 level. This is now the most critical short-term support. If the stock opens on Monday and breaks decisively below this level, it could signal further downside momentum.
-
Key Resistance Level: On the upside, the previous close of
802.50 serves as the next major hurdle.
For Short-Term Traders: The high volatility and sharp sell-off suggest risk. It may be prudent to wait for confirmation on Monday. A bounce off the $775 support could present a tactical opportunity, while a break below it could favor bearish positions.
For Long-Term Investors: A single day’s drop, while notable, is often just noise in a long-term strategy. The fundamental picture, including the high P/E ratio and steady dividend, remains intact. For those with a long-term bullish thesis on Eli Lilly, this pullback could be viewed as a potential opportunity to acquire shares at a lower price. However, they should also monitor to see if this is the start of a larger correction.
In conclusion, Eli Lilly stock ended the day on a weak footing. The next trading session will be pivotal in determining whether Thursday’s drop was a one-off event or the beginning of a new downward trend. All eyes will be on the critical $775 support level.
Disclaimer: This article is for informational purposes only and is based on the analysis of the provided image. It does not constitute financial advice. All investing involves risk, and you should conduct your own research and consult with a certified financial advisor before making any investment decisions.


