
Meta Platforms Inc. (NASDAQ: META) stock is demonstrating significant bullish momentum in the opening hour of trading today, catching the eye of investors and traders alike. With a powerful surge right after the opening bell, the social media giant is signaling strong buying interest. This article will break down the essential data from the chart and provide an analysis of whether the stock is likely to continue its climb.
The Current Market Picture
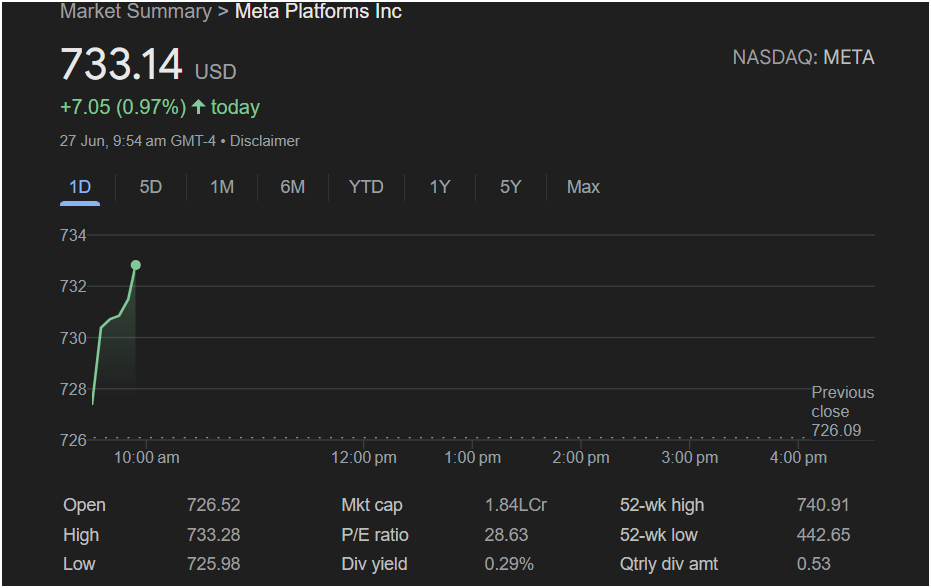
The data, captured at 9:54 am GMT-4 on June 27, shows Meta stock in the midst of a strong upward move. Here are the critical details for any trader:
-
Current Price: $733.14 USD
-
Today’s Gain: +$7.05 (+0.97%)
-
Previous Close: $726.09
-
Today’s Open: $726.52
-
Day’s Range (so far): Low of $725.98 to a High of $733.28
The stock gapped up slightly at the open, briefly dipped to test the previous day’s closing price, and then launched into a powerful rally. This “gap and go” pattern is a classic bullish signal, indicating that buyers are in firm control early in the session.
Intraday Chart Analysis
The 1-day chart, though only showing the first 24 minutes of trading, is telling a clear story. The sharp, near-vertical climb from the day’s low to its current high suggests aggressive buying pressure. The brief dip below the previous close was quickly bought up, reinforcing the support at that level and turning it into a launchpad for the morning rally.
Traders will now be watching to see if this momentum can be sustained throughout the day. The current price is hovering right at the session’s high, a sign of continued strength.
Key Financial Metrics for Context
To understand the bigger picture, a trader must look at the key financial data:
-
52-Week Range: $442.65 – $740.91
-
P/E Ratio: 28.63
-
Market Cap: 1.84LCr (Mega-Cap)
-
Dividend Yield: 0.29%
The most critical piece of information here is the 52-week high of $740.91. With the stock currently trading around $733, it is now within striking distance of this major resistance level. A P/E ratio of 28.63 is reasonable for a major tech company, suggesting that while it’s priced for growth, it may not face the same valuation pressures as some of its peers.
Will the Stock Go Up or Down Today? Is it Right to Invest?
Based on the strong opening momentum, the immediate outlook for Meta stock today is decidedly bullish.
The Bullish Case: The powerful opening rally is the primary indicator. If buying pressure continues, the stock’s next logical target is its 52-week high of $740.91. A decisive break and hold above this level could trigger a significant new leg up, as it would signal a major breakout to the rest of the market.
The Bearish Case (Reversal Scenario): The primary risk is a failure to maintain momentum. If the stock begins to fade and falls back below the key
726.52 would negate the bullish morning and could see sellers take control.
For the Trader: The decision to invest today depends on your risk tolerance.
-
For Aggressive Bullish Traders: The current momentum presents a compelling case for a long position. The primary target is the 52-week high. A stop-loss could be placed below a key psychological level like $730 or the day’s open.
-
For Cautious Traders: It may be prudent to wait for confirmation. A confirmed breakout above the $740.91 high would be a much stronger signal to enter a long position. Alternatively, waiting for a small pullback that holds support could offer a better entry point.
In conclusion, Meta Platforms stock has started the day with impressive strength. All eyes are now on whether it has the power to challenge and break its 52-week high.
Disclaimer: This article is an analysis based on the provided static image and its data from June 27. It is not live financial data. Market conditions are dynamic and can change rapidly. This content is for informational purposes only and should not be considered financial or investment advice. Always conduct your own thorough research before making any trading decisions.


