
NORTH CHICAGO, IL – AbbVie stock (NYSE: ABBV) took investors on a wild ride during Tuesday’s trading, swinging dramatically before settling into a tight, flat range to close nearly unchanged. This pattern of high volatility followed by stark indecision, combined with conflicting fundamental signals, suggests the pharmaceutical giant is poised for a significant move, and traders are watching closely for which direction it will break.
A Session of Swings and Stability
AbbVie Inc. closed the day at
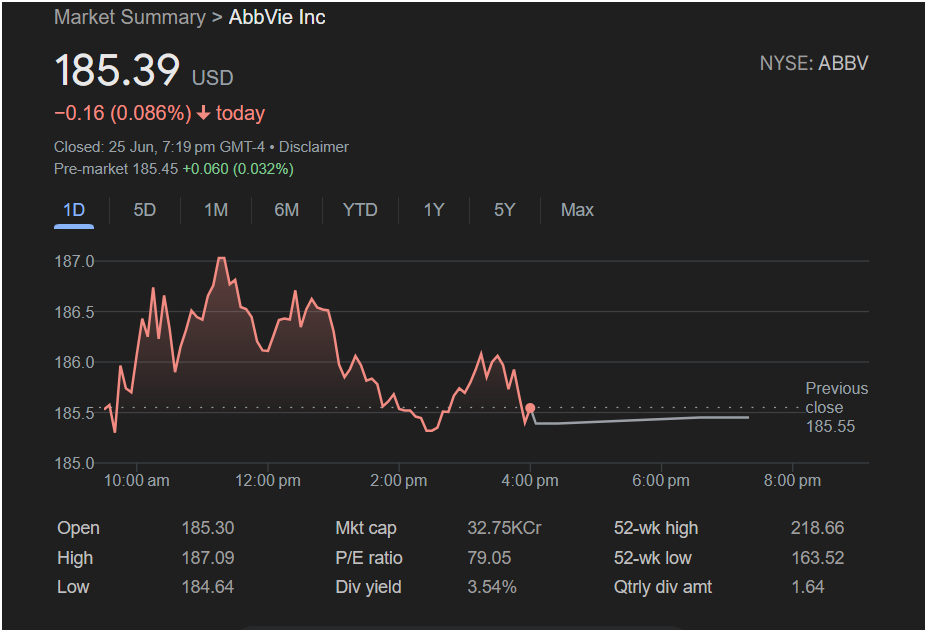
0.16 (0.086%). The intraday action, however, was far from calm.
The stock opened at $185.30, below the previous close of
187.09** before noon. This bullish momentum was short-lived, as sellers took over and pushed the price all the way down to its daily low of $184.64 by mid-afternoon.
The most notable feature on the chart is what happened next. For the final two hours of trading, the stock went completely flat, trading in an extremely narrow band around the
185.50 level. This “flatline” indicates a perfect equilibrium between buyers and sellers, a market coiling with energy and awaiting a catalyst.
Key Financial Metrics: A Tale of Two Valuations
The indecisive price action is perfectly mirrored by AbbVie’s conflicting fundamental metrics, creating a classic puzzle for investors:
-
P/E Ratio (79.05): An extremely high Price-to-Earnings ratio of 79.05 signals that the market has priced in very optimistic expectations for future growth. This premium valuation can make the stock vulnerable to sharp corrections if it fails to meet these high expectations.
-
Dividend Yield (3.54%): Conversely, AbbVie offers a robust and highly attractive dividend yield of 3.54%. This is a significant draw for income-focused investors and tends to provide a strong “floor” of support for the stock price.
-
The Conflict: This creates a tug-of-war: is ABBV a high-growth stock justified by its P/E, or a stable value/income stock defined by its dividend? Tuesday’s chart suggests the market can’t decide.
Market Outlook for Wednesday: Breakout or Breakdown?
Given the tight consolidation, the outlook for Wednesday hinges on a breakout from the established intraday range.
The Bullish Case: If buyers can push the stock above the consolidation ceiling around $185.55 (the previous day’s close), the first target would be the afternoon resistance near
187.09**. The strong dividend yield provides a fundamental reason for bulls to defend current levels.
The Bearish Case: The high P/E ratio presents a risk. If the stock breaks below its consolidation floor and, more importantly, takes out the day’s low and key support level of $184.64, it would signal that sellers have won the battle. This could lead to a deeper pullback as the premium valuation comes under pressure.
Is It Right to Invest Today?
This is a classic “wait for confirmation” scenario for traders.
For the short-term trader, entering a position within the current tight range is highly risky. The prudent strategy is to wait for a decisive breakout. A move above the range signals a long entry, while a break below signals a short entry, with clear stop-loss levels defined by the range itself.
For the long-term investor, the decision depends entirely on investment philosophy. An income investor will find the 3.54% yield extremely compelling and may use any dip as an opportunity to buy. A growth or value investor, however, may be deterred by the very high P/E ratio and choose to wait for a more significant price correction to achieve a better entry point.
Disclaimer: This article is an analysis based on historical data from the provided image and is for informational purposes only. It is not financial advice. Stock market performance is subject to numerous external factors, and past performance is not an indicator of future results. Always conduct your own research and consult with a qualified financial advisor before making any investment decisions.


