
Traders are taking note of KKR & Co stock after a powerful performance in the last trading session, which saw the stock recover from early lows to close near its daily high. This strong buying pressure throughout the day sets a positive tone for the upcoming trading session. Here’s a detailed breakdown of the key metrics and what they signal for investors.
Key Takeaways from the Data:
-
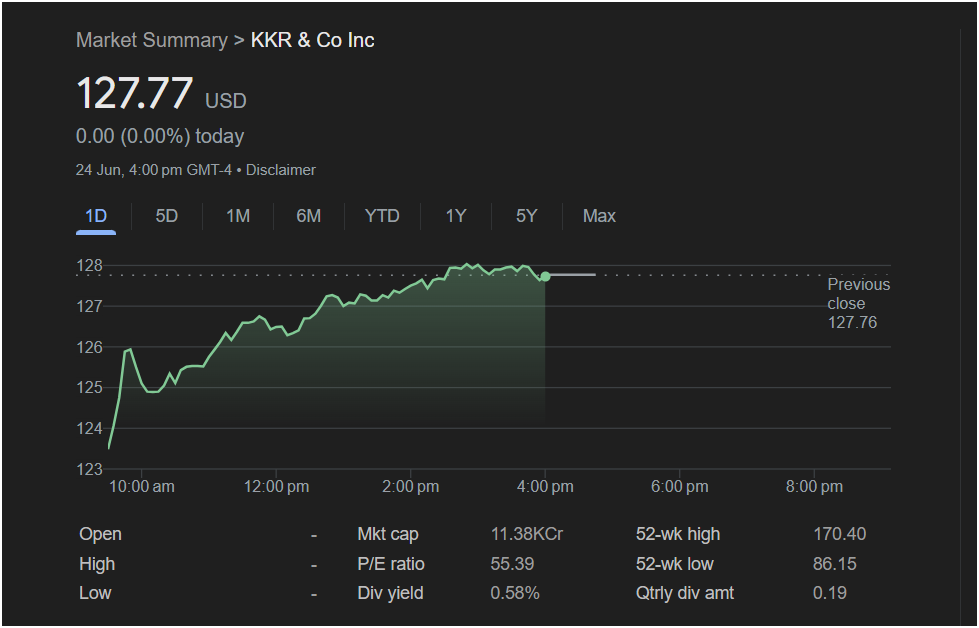
Closing Price: KKR & Co Inc. (KKR) ended the trading day on Monday, June 24th, at $127.77 USD.
-
Previous Day’s Performance: The stock officially closed flat with a change of $0.00 (0.00%), which simply means it closed virtually unchanged from the previous day’s close of $127.76.
-
Intraday Trend: The most telling feature is the 1-day chart. The stock opened significantly lower (around the $123.50 mark) but then embarked on a steady and impressive climb throughout the entire session, peaking just below $128 before the close. This indicates sustained buying interest and a strong bullish sentiment.
 Technical Outlook and Key Levels
The stock’s strong close after a day-long rally is a technically bullish signal. It suggests that buyers were in firm control and that the momentum could carry over into the next trading day.
Key price levels for traders to consider are:
-
52-Week High: $170.40
-
52-Week Low: $86.15
Currently trading at $127.77, KKR is well positioned within its 52-week range. Unlike a stock testing its absolute peak, KKR has significant room to run before encountering potential resistance at its 52-week high. This could be seen as a positive for traders looking for further upside potential. The strong upward trend from the 52-week low demonstrates solid long-term momentum.
Fundamental Metrics for Context
These financial details provide a wider view of the company’s valuation and health:
-
Market Cap: 11.38KCr (This represents a large-cap company with a market capitalization of approximately $113.8 Billion).
-
P/E Ratio: 55.39 – This is a relatively high P/E ratio, suggesting that investors have high expectations for the company’s future earnings growth.
-
Dividend Yield: 0.58% – KKR offers a modest dividend, paying out $0.19 per share quarterly. This provides a small but steady return to shareholders.
Will the Market Go Up on Tuesday? Is It a Good Time to Invest?
Based on the provided chart for Monday, June 24th, the outlook for KKR & Co stock for the next session (Tuesday) is optimistic. The consistent buying pressure that drove the stock up all day is a strong indicator of positive sentiment. The market’s ability to not only recover from a lower open but also to post a sustained rally suggests that the path of least resistance is currently upward.
For Traders: The strong intraday trend is a clear bullish signal. Traders might see this as an opportunity to ride the momentum, with the next logical area of interest being the recent highs around the $128 level. A break above that could open the door for further gains.
For Investors: KKR is a well-established large-cap firm in a clear uptrend. While the high P/E ratio warrants consideration and further research into its growth prospects, the stock’s strong performance is undeniable. For those with a bullish outlook on the financial and private equity sectors, the current momentum makes KKR a compelling name to watch.
Disclaimer: This article is an analysis based solely on the provided image and does not constitute financial advice. Market conditions are volatile and can change rapidly. All investors and traders should conduct their own thorough research and consult with a qualified financial advisor before making any investment decisions.


