
Alphabet Inc. (Class C) stock closed Tuesday’s session with solid gains and is showing continued bullish momentum in pre-market trading, setting the stage for a potentially positive open for the next session. For traders looking to capitalize on short-term movements, understanding the key price levels from the recent session is crucial.
Based on the latest data, Alphabet’s stock closed at
1.73 (1.04%) for the day. More importantly for the immediate future, pre-market activity shows the stock trading even higher at
0.90 (0.54%). This pre-market surge suggests positive sentiment carrying over and points towards a higher opening bell on Wednesday, June 26th.
Tuesday’s Trading Session: A Detailed Look
To understand where the stock might go, we first need to analyze its recent performance. Here’s a breakdown of Tuesday’s trading activity:
-
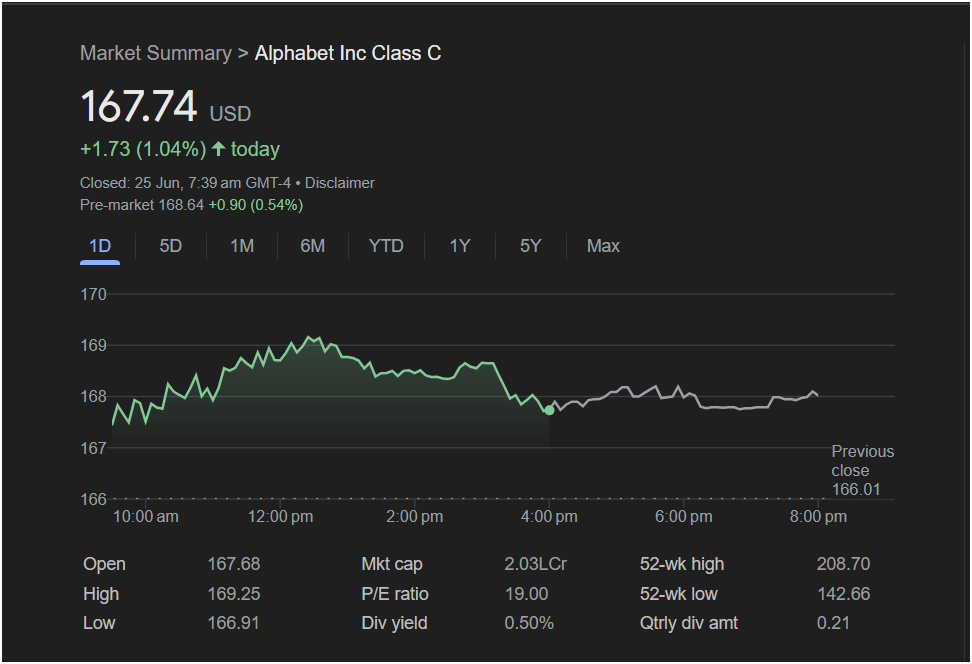
The stock opened at $167.68, slightly below its eventual close.
-
It experienced a strong rally through the morning, reaching a daily high of $169.25. This level now acts as a key short-term resistance. A decisive break above this price could signal further upward momentum.
-
The daily low was $166.91, which establishes a critical support level. If the stock faces selling pressure, traders will watch to see if it holds above this mark.
-
The stock closed higher than the previous day’s close of $166.01, confirming a positive trend for the session.
The intraday chart shows a classic pattern of a strong morning run followed by some profit-taking in the afternoon, which is a healthy market action. The fact that it held most of its gains and is climbing in the pre-market is a bullish indicator.
What Traders Need to Know for Today
The positive pre-market activity is the most significant indicator for the upcoming session. It suggests that buying interest remains strong. However, investing today requires a clear strategy based on these key data points.
Key Financial Metrics at a Glance:
-
Pre-Market Price: $168.64
-
Key Resistance: $169.25 (Tuesday’s High)
-
Key Support: $166.91 (Tuesday’s Low)
-
52-Week High: $208.70
-
52-Week Low: $142.66
-
Market Cap: Over $2.03 Trillion
-
P/E Ratio: 19.00
-
Dividend Yield: 0.50%
Will The Market Go Up or Down? Is it Right to Invest?
Based on the available data, the indicators for Alphabet stock are pointing upwards for the start of the next trading day. The strong pre-market performance is a clear signal of bullish sentiment.
The Bullish Scenario: If the stock opens strong and breaks through the $169.25 resistance level with significant volume, it could attract more buyers and push towards higher levels.
The Bearish Scenario: If the stock fails to break resistance or falls below the pre-market price, the first line of defense is the $166.91 support level. A break below this could indicate that the positive momentum has faded, potentially leading to a price drop.
Conclusion for Investors:
For short-term traders, the outlook appears favorable for a bullish play, with clear resistance and support levels to manage risk. For long-term investors, the stock is trading closer to its 52-week high than its low, indicating strong performance over the past year. The P/E ratio of 19.00 is not excessively high for a tech giant, and the recent introduction of a dividend (0.50% yield) adds a new, albeit small, incentive for holding the stock.
As always, while technical indicators are positive, external market news or broader economic data could influence the stock’s direction.
Disclaimer: This article is an analysis based on the provided image and publicly available data. It is not financial advice. Market conditions are subject to change, and all investment decisions should be made after conducting your own thorough research and/or consulting with a qualified financial advisor.


