
International Business Machines Corp. (IBM) is showing powerful bullish momentum, closing the previous session at a new 52-week high and continuing its climb in pre-market trading. For traders positioning for the week ahead, IBM stock is at a critical juncture. The data points towards a potential breakout, but key resistance levels must be respected. This article provides a comprehensive analysis of the information a trader needs for Monday’s session.
The Bullish Case: Unmistakable Strength
The latest market data for IBM is overwhelmingly positive, suggesting the upward trend has legs.
-
Massive Daily Gain: The stock surged to close at
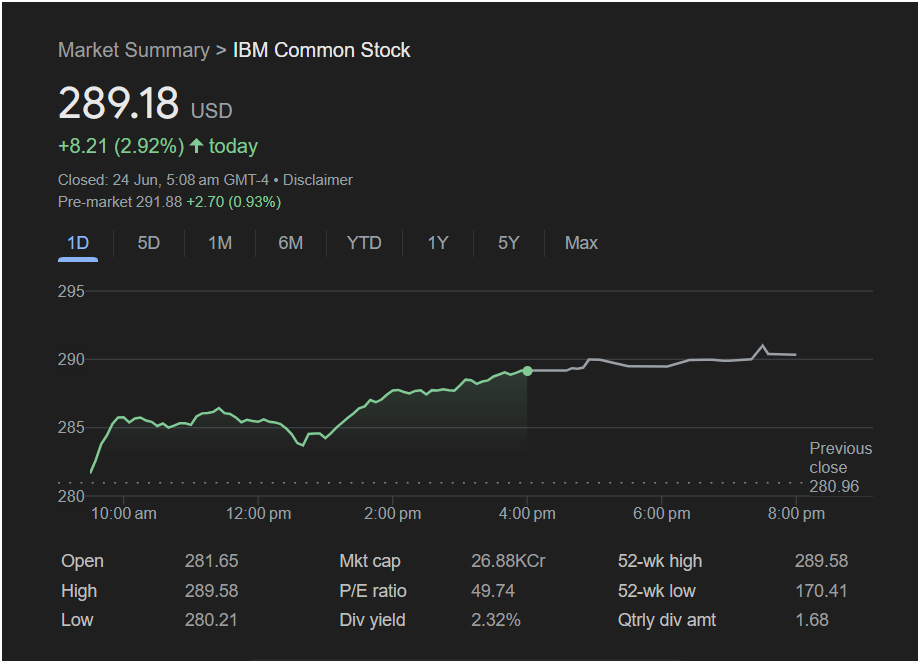
8.21 (2.92%). This strong performance indicates high investor confidence.
-
Closing at the Peak: Critically, the day’s high of $289.58 is also the stock’s 52-week high. Closing at or near a yearly peak is a powerful technical signal, often preceding a continued move higher as it shows buyers were in full control into the close.
-
Pre-Market Continuation: The bullish sentiment is carrying over. In pre-market activity, the stock is already up to
291.88∗∗,afurthergainof∗∗291.88**, a further gain of **2.70 (0.93%). This signals a likely “gap up” at the market open, placing the stock firmly in breakout territory.
Points of Caution and Key Metrics
While the momentum is strong, savvy traders will also consider potential headwinds and the stock’s valuation.
-
Resistance at the High: A 52-week high is a double-edged sword. While it signals a breakout, it is also a natural point for some investors to take profits, which can create selling pressure and act as a psychological resistance level. The key question is whether new buyers can absorb this selling.
-
Elevated P/E Ratio: IBM’s Price-to-Earnings (P/E) ratio stands at 49.74. This is a relatively high valuation for a mature tech company, suggesting that significant future growth is already priced into the stock. A high P/E can make a stock more susceptible to pullbacks if it fails to deliver on high expectations.
-
Solid Dividend Yield: For those with a longer-term view, the dividend yield of 2.32% offers a solid income stream, providing a degree of support for the stock price.
Is It Right to Invest Today?
For a momentum or day trader, the setup is compelling. The key will be to watch the price action at the market open. A sustained move above the 52-week high of ~$289.58 on good trading volume would be a strong confirmation of the breakout and a potential entry signal.
For a long-term investor, the decision is more nuanced. The recent price appreciation is a positive sign of the market’s belief in IBM’s strategic direction (likely related to AI and hybrid cloud). However, entering at a 52-week high with a high P/E ratio requires conviction in the company’s long-term growth story. The dividend provides a nice incentive to hold the stock through any potential volatility.
Key Data Summary for Monday’s Session:
-
Last Closing Price: $289.18
-
Pre-Market Price: $291.88 (+0.93%)
-
Key Resistance to Watch: The 52-week high of $289.58. Breaking and holding above this is key.
-
Key Support Level: The previous day’s low of ~$280.21.
Outlook: IBM stock is poised to open higher on Monday and challenge new highs. The overwhelming evidence points to continued upward momentum. The primary focus for traders will be whether the stock can decisively break and hold above its 52-week high, turning former resistance into new support and paving the way for the next leg up.
Disclaimer: This article is for informational purposes only and is based on the analysis of the provided image. It is not financial advice. All investors should conduct their own research and consult with a financial professional before making any investment decisions.


