
Costco Wholesale Corp (COST) stock delivered a session full of drama on Thursday, June 20th, ultimately closing in the green but leaving traders with a powerful technical signal to analyze. The retail giant finished the day at
5.39 (0.55%). However, the real story wasn’t the modest gain, but the stock’s impressive intraday comeback.
For traders setting their strategy for Monday, understanding the nature of Thursday’s powerful recovery is essential for predicting where the stock might be headed next.
Dissecting Thursday’s Trading Action
The intraday chart for Costco paints a clear picture of resilience and aggressive dip-buying.
-
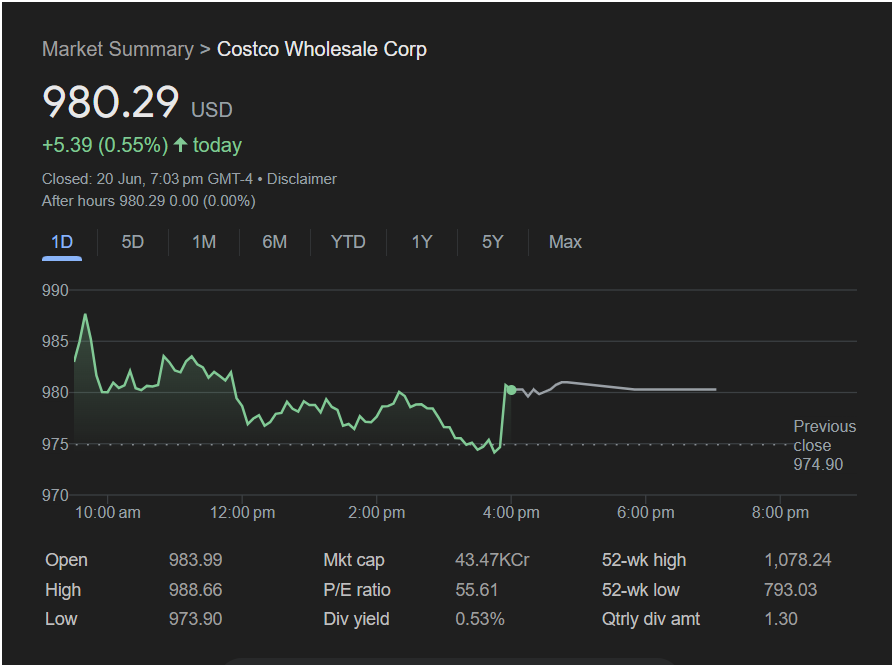
Morning Volatility: The stock opened strong at $983.99 and quickly hit its session high of $988.66. However, sellers stepped in, pushing the price down throughout the morning and into the afternoon.
-
The Key Reversal: The selling pressure culminated around 3:30 pm, with the stock hitting its low for the day at $973.90. At this critical support level, buyers entered the market with force.
-
The V-Shaped Recovery: In the final 30 minutes of trading, Costco stock staged a dramatic V-shaped recovery, surging from its lows and closing firmly above the $980 mark. The stock then went flat into the close and in after-hours trading, suggesting the market is pausing after the sharp move.
Key Financial Metrics to Consider
Here are the vital statistics from Thursday’s session that every trader should note:
-
Closing Price: 980.29 USD
-
Day’s High: 988.66
-
Day’s Low: 973.90
-
Previous Close: 974.90
-
52-Week Range: 793.03 – 1,078.24
-
P/E Ratio: 55.61
A key point of interest is the high Price-to-Earnings (P/E) ratio of 55.61. This indicates that investors are willing to pay a significant premium for Costco’s earnings, a testament to its strong brand and growth expectations.
Market Outlook: Will the Stock Go Up or Down on Monday?
Based on the technical price action from Thursday, the immediate sentiment leans bullish.
The Bullish Case:
The dramatic rebound from the $974 level is a powerful technical signal. It shows that there is significant underlying demand for the stock and that buyers are quick to defend it against dips. This type of V-shaped recovery often precedes further upward movement, as it traps short-sellers and builds confidence among bulls.
The Bearish Case (Points of Caution):
Despite the strong recovery, the stock still closed below its opening price and its session high. This could indicate there is still selling pressure at higher levels. Furthermore, its high P/E ratio makes the stock potentially more sensitive to any negative market news or shifts in investor sentiment.
Is It Right to Invest Today?
Thursday’s powerful reversal from the lows makes a compelling bullish case for Costco stock. The aggressive buying at the ~$974 level has established it as a new, strong area of short-term support.
For traders looking to make a move, Monday’s action will be telling. The most prudent approach would be to watch for confirmation of this bullish reversal. If Costco stock can hold above the
988.66, it would signal that the upward momentum is continuing. A break below the day’s low of $973.90, however, would negate the bullish signal.
The evidence from Thursday suggests that buying the dips in Costco remains a viable strategy for now.
Disclaimer: This article is an analysis based solely on the provided image of stock data from a single trading day. It is not financial advice. Market conditions can change rapidly due to news, economic data, and overall market sentiment. All investors should conduct their own research and consider their risk tolerance before making any investment decisions.


