
An Eli Lilly stock analysis reveals a tough day for the pharmaceutical giant on Monday, June 20, as shares experienced a significant sell-off. The stock, a favorite among healthcare investors, closed with a substantial loss, leaving market participants to wonder if this is a temporary dip or the start of a more pronounced downturn.
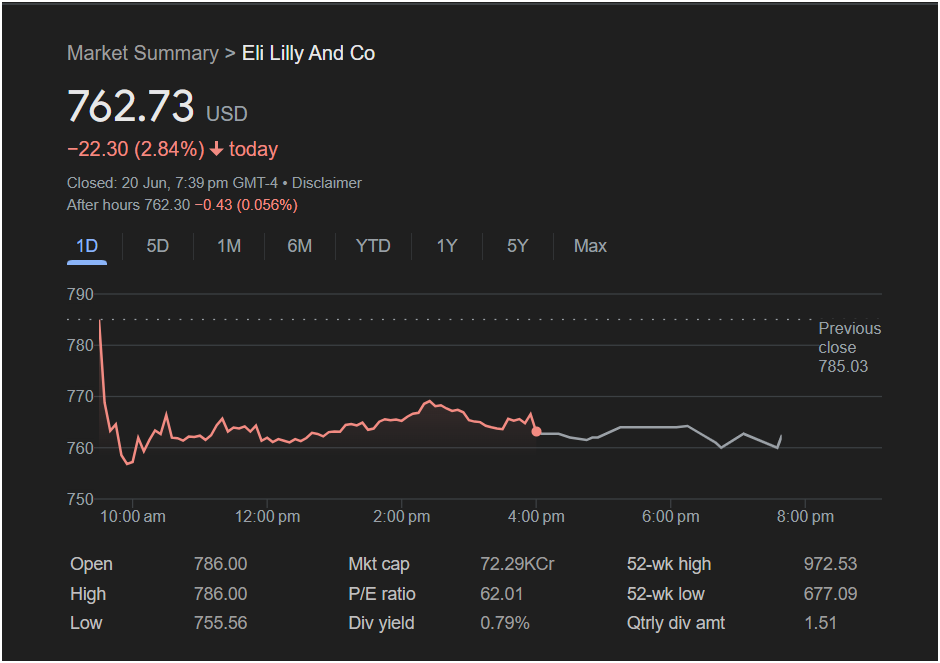
Eli Lilly And Co (LLY) ended the main trading day at 762.73 USD, a steep decline of $22.30, or 2.84%. The negativity bled into after-hours, with the stock ticking down another $0.43 (0.056%) to $762.30, signaling that bearish pressure had not yet subsided at the close.
Dissecting Monday’s Trading Action
The 1-day chart tells a clear story of a “gap and fade,” where an initial sign of strength was quickly and decisively rejected by sellers.
-
Immediate Reversal: The stock opened at $786.00, gapping up slightly from the previous close of $785.03. This was also the high for the day, as sellers took control immediately at the opening bell.
-
The Morning Plunge: Shares plummeted in the first hour of trading, crashing to the day’s low of $755.56. This aggressive selling erased all opening gains and pushed the stock deep into negative territory.
-
A Weak Recovery: For the remainder of the session, the stock staged a slow, grinding recovery from its lows but failed to reclaim a significant portion of the losses. It struggled to trade above the $770 mark, indicating a lack of strong buying conviction.
Closing well below its opening price and the previous day’s close points to strong bearish sentiment dominating the day’s session.
 Essential Metrics for Eli Lilly Traders
To make an informed decision, traders must look at the key data points from Monday’s performance:
-
Open: 786.00
-
High: 786.00
-
Low: 755.56
-
Previous Close: 785.03
-
Market Cap: 72.29KCr
-
P/E Ratio: 62.01 (This high valuation reflects strong market expectations for the company’s growth, particularly from its popular drugs).
-
52-Week Range: The current price sits comfortably above the 52-week low of $677.09 but is well off its high of $972.53.
-
Dividend Yield: 0.79%
Is It the Right Time to Invest in LLY?
Following a sharp drop of nearly 3%, traders and investors are faced with a classic dilemma: buy the dip or wait for the dust to settle?
The Bearish Outlook: The price action on Monday was decisively negative. The failure to hold the opening price and the immediate, sharp sell-off are significant warning signs. The momentum is clearly to the downside, and a further test of the lows is possible.
The Bullish Outlook: For long-term believers in Eli Lilly’s pipeline and market position, a 2.8% discount could be seen as an attractive entry point. The stock did find buyers at the day’s low of $755.56, establishing this as a new, critical support level.
for Traders:
Given the strong downward momentum, jumping in to invest today could be catching a falling knife.
-
Prudent traders will be closely watching the day’s low of $755.56. If the stock can hold above this level in the next session, it may signal that the worst of the selling is over. A break below it would likely lead to further declines.
-
On the upside, bulls will need to see the price reclaim the
786.00, which now stands as major resistance.
For now, caution is advised. Waiting for signs of price stabilization may be the wisest course of action before committing capital.
Disclaimer: This article is for informational purposes only and is not financial advice. All investment decisions should be made with the help of a qualified financial professional.


