
 Apple Inc. (AAPL) stock is presenting a complex picture for traders heading into the next session, balancing overnight optimism with bearish momentum from the previous day’s close. While the stock officially closed unchanged, the day’s trading activity tells a story of a battle between buyers and sellers that investors must watch closely.
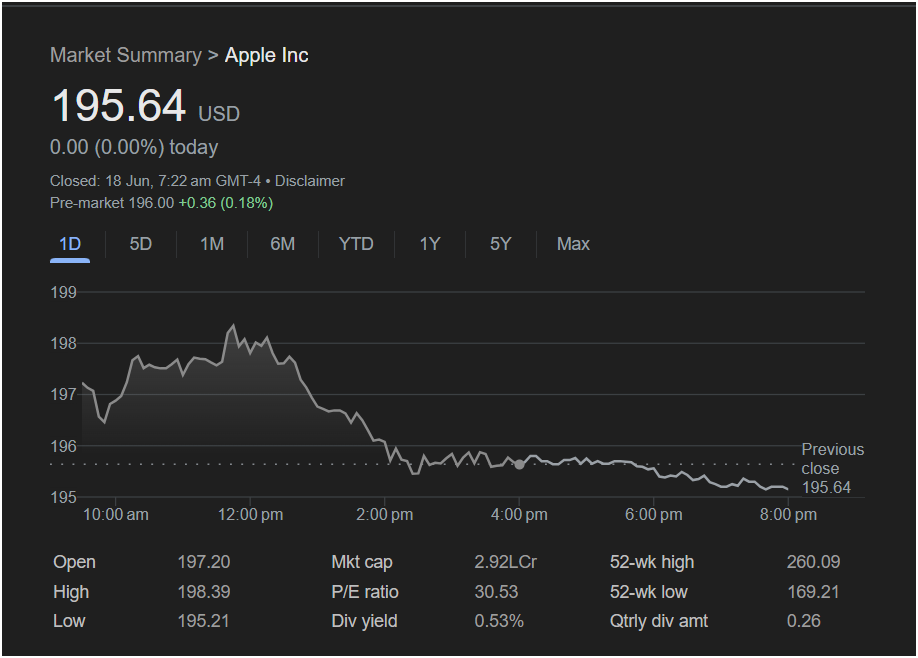
This article provides a detailed breakdown of the information from the latest market data to help you understand the potential direction for Apple stock.
A Tale of Two Halves in the Last Session
Based on the 1-day chart, Apple stock experienced a volatile trading day. Here is a summary of the key action:
-
Strong Open: The stock opened strongly at $197.20.
-
Mid-day Peak: Buyers pushed the price to a daily high of $198.39 around noon.
-
Afternoon Reversal: Following the peak, the stock entered a sustained downtrend for the rest of the afternoon, falling to a low of $195.21.
-
Flat Close: It ultimately closed at $195.64, exactly the same as the previous close, resulting in a 0.00% change for the day.
This pattern, where a stock fails to hold its early gains and closes near the day’s low, is often interpreted as a bearish signal by short-term traders. It suggests that selling pressure overwhelmed initial buying interest, and the momentum at the end of the day was negative.
The Pre-Market Signal: A Glimmer of Hope
Despite the weak finish, the pre-market data shows a glimmer of positive sentiment. As of the time of the screenshot (7:22 am GMT-4), Apple stock was trading at
This pre-market uptick suggests that there is some buying interest before the opening bell. The crucial question for today’s session will be whether this early strength has enough force to reverse the negative momentum from the previous day’s sell-off.
Key Data Points for Traders
Here are the essential figures every trader should have on their screen for the upcoming session:
-
Previous Close: $195.64
-
Pre-Market Indication: $196.00
-
Key Support Level to Watch: $195.21 (the previous day’s low). A break below this level could signal further selling pressure.
-
Key Resistance Level to Watch: $198.39 (the previous day’s high). The stock would need to convincingly break through this level to indicate a return of bullish control.
-
52-Week Range: $169.21 – $260.09. The stock is still trading in the upper end of its yearly range, indicating strong long-term performance.
-
Market Cap: 2.92L Cr (Note: This likely represents approximately $2.92 Trillion USD, a standard valuation for Apple).
-
P/E Ratio: 30.53
Investment Outlook: Should You Invest Today?
For Short-Term Traders:
Today is a day for caution. The conflicting signals—a bearish closing pattern versus a bullish pre-market—create uncertainty. The first hour of trading will be critical. Watch to see if the stock can hold above the
195.21, it could be a sign that sellers remain in control.
For Long-Term Investors:
A single day of price movement is less critical for a long-term strategy. The decision to invest should be based on your belief in Apple’s fundamental business, product pipeline, and overall market conditions. The stock remains a blue-chip company with a solid dividend yield (0.53%) and is trading well above its 52-week low. A small dip could be seen as a buying opportunity by those with a long-term horizon.
In conclusion, the market is sending mixed signals for Apple stock. While pre-market activity points to a slightly positive start, the bearish pressure from the previous session’s close cannot be ignored. Traders should monitor the key support and resistance levels closely to navigate today’s potential volatility.
Disclaimer: This article is for informational purposes only and is based on the provided screenshot. It does not constitute financial advice. All investment decisions should be made with the help of a qualified financial professional after conducting your own thorough research.


