
Stryker Corp (NYSE: SYK) stock opened the week on a bearish note, facing immediate selling pressure in the first hour of trading on Monday, June 17th. For traders considering a move, understanding the current technical picture and key financial metrics is crucial. This article breaks down the essential information from the market summary.
Today’s Market Action: A Closer Look
As of 9:50 am GMT-4, Stryker Corp’s stock was trading at
2.82 or 0.75% for the day.
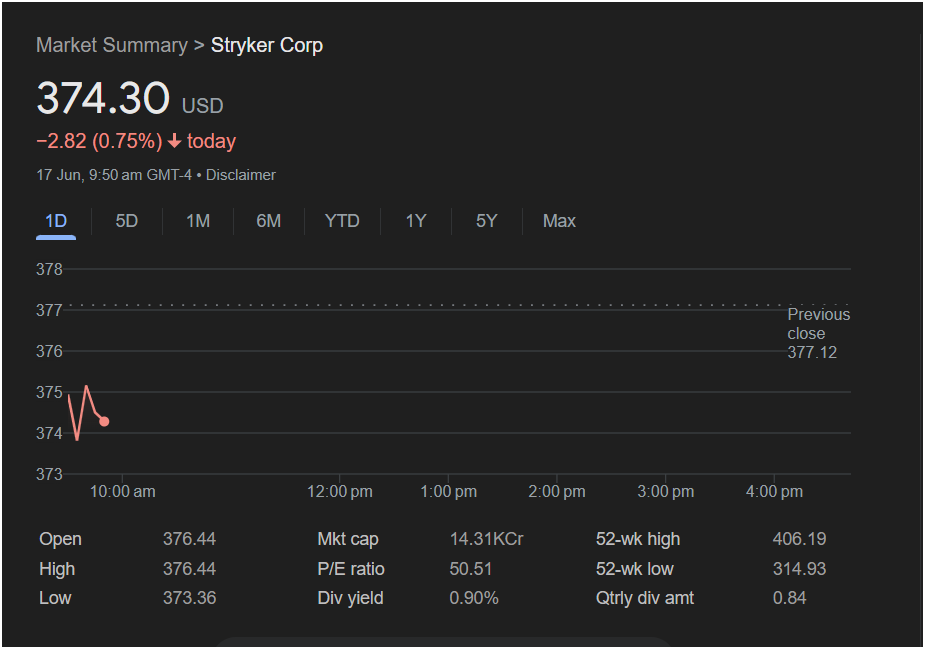
The intraday chart reveals a story of early weakness. The stock opened at $376.44, significantly lower than the previous day’s close of $377.12. This “gap down” opening is often a sign of negative sentiment carrying over into the new trading session. Immediately after the open, the stock failed to gain upward momentum, marking its high for the day at the opening price and subsequently falling to a low of $373.36.
While the price has slightly bounced off its morning low, it remains under pressure. Traders will be closely monitoring whether the $373 level can act as a support base for the rest of the session.
Key Financial Metrics for Investors
To make an informed decision, a trader must look beyond the intraday price action. Here are the vital statistics for Stryker Corp from the summary:
-
Market Capitalization: 14.31KCr (This notation, common in some regions, translates to approximately $143.1 Billion USD), positioning Stryker as a major player in the medical technology industry.
-
P/E Ratio: At 50.51, the Price-to-Earnings ratio is relatively high. This indicates that investors are paying a premium for the company’s earnings, likely based on expectations of strong future growth. However, a high P/E can also suggest the stock is overvalued, posing a risk if growth falters.
-
52-Week Range: The stock has traded between
406.19 over the past year. The current price is firmly in the upper half of this range, but it is down about 8% from its 52-week high, showing a recent pullback.
-
Dividend Information: Stryker offers a dividend yield of 0.90%, with a quarterly payout of $0.84 per share. While modest, this provides a small, consistent return for long-term shareholders.
Should You Invest Today? Outlook for Monday
Based on the available data, the immediate sentiment for Stryker stock is bearish. The gap down open and the failure to reclaim the previous day’s closing price are negative short-term signals.
-
For the Bears: If the stock breaks below the morning low of $373.36, it could signal further downside for the day. The next major support levels would need to be identified on a longer-term chart.
-
For the Bulls: A potential buying opportunity could arise if the stock successfully defends the $373 support level and begins to move back up. Reclaiming the opening price of $376.44 and the previous close of $377.12 would be the first signs of a potential reversal in momentum.
for Traders:
Investing right now carries significant risk due to the clear downward momentum.
-
Conservative traders may want to wait for signs of stabilization or a clear reversal pattern before entering a position. Watching for the stock to build a solid base above its intraday low would be a prudent strategy.
-
Aggressive, short-term traders might see the dip as a “buy the dip” opportunity, but this requires a high tolerance for risk and a clear stop-loss strategy in case the stock continues to fall.
Given the high P/E ratio, any investment in Stryker should be made with a long-term perspective on the company’s growth prospects in the medical device sector, rather than just on today’s volatile price action.
Disclaimer: This article is for informational purposes only, based on the data provided in a single screenshot. It should not be considered financial advice. All investors should conduct their own due diligence and consult with a qualified financial professional before making any investment decisions.


