
Meta Platforms Inc. (META) stock took a noticeable hit in its last trading session, closing down significantly. This has left many traders at a crossroads, wondering if this dip is a golden opportunity to buy into the tech giant or a warning of further declines. This article breaks down all the essential data from today’s market activity to help you make a more informed decision.
Today’s Market Performance Unpacked
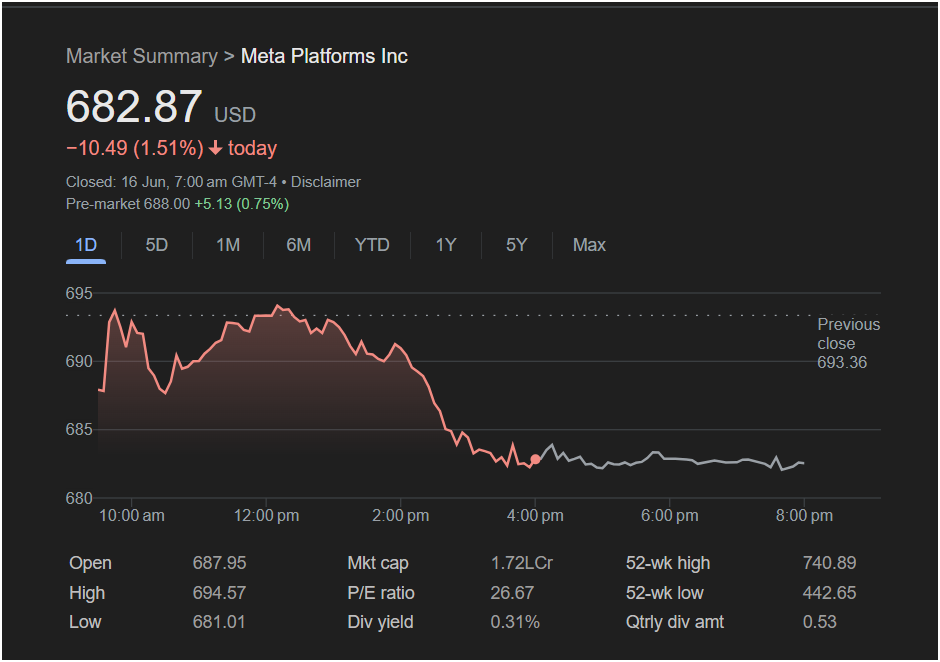
Here is a summary of the key figures for Meta Platforms from the latest trading session:
-
Closing Price: 682.87 USD
-
Daily Change: A significant decrease of -10.49 (1.51%)
-
Pre-Market Activity: Showing signs of a potential recovery at 688.00, an increase of +5.13 (0.75%)
The stock closed well below its previous day’s close of 693.36 USD. The intraday chart reveals a telling story: after opening at 687.95 and rallying to a high of 694.57 around midday, the stock experienced a sharp sell-off in the afternoon, hitting a low of 681.01 before stabilizing. This strong downward momentum in the latter half of the session is a key point for traders to note.
 Crucial Financial Metrics for Your Watchlist
A trader’s decision should be based on more than just one day’s price movement. Here are the fundamental metrics for META:
-
52-Week Range: The stock has a wide range, from a low of 442.65 USD to a high of 740.89 USD. At its current price, META is trading considerably off its 52-week high, which could suggest either a loss of momentum or that the stock is available at a relative discount.
-
P/E Ratio: Meta’s Price-to-Earnings ratio stands at a reasonable 26.67. Compared to some of its mega-cap tech peers, this valuation is not excessively high, which may appeal to value-conscious growth investors.
-
Market Capitalization: As a trillion-dollar company (indicated by the regional “1.72L Cr” figure), Meta is a blue-chip stock with a dominant market position, offering a degree of stability even during volatile periods.
-
Dividend Yield: The company provides a 0.31% dividend yield, with a quarterly dividend payment of $0.53. While this is a modest yield, the introduction of a dividend is a sign of financial maturity and a commitment to returning capital to shareholders.
Trader’s Verdict: To Buy, Sell, or Hold?
By combining the day’s trading action with these financial metrics, we can outline potential strategies.
The Bullish Argument (Why this could be a buying opportunity):
-
Valuation and Discount: The stock is trading more than 7% below its 52-week high, and the P/E ratio is not in “bubble” territory. This dip could be an attractive entry point for investors who believe in Meta’s long-term story in AI, advertising, and the metaverse.
-
Pre-Market Rebound: The positive pre-market trading suggests that early sentiment is favoring a bounce back. Traders may be looking to capitalize on the previous day’s drop.
-
Shareholder-Friendly: The existence of a dividend, even a small one, can attract a wider base of investors, potentially providing a floor for the stock price.
The Bearish Argument (Reasons to be cautious):
-
Strong Selling Pressure: The sharp decline in the afternoon is a significant red flag. It indicates that sellers were in firm control by the end of the day, and that negative momentum could carry over.
-
Broken Support?: The stock fell decisively below the previous close of 693.36, a key psychological level. The next major support to watch would be the day’s low of 681.01. A break below this could signal further downside.
Conclusion for Today’s Trader
For the short-term day trader, the action will be critical at the market open. Watch to see if the stock can hold above its pre-market high of
693-
681.01, more selling could be imminent.
For the long-term investor, a 1.5% drop in a fundamentally strong company like Meta is often just market noise. If your investment thesis remains intact, this pullback could be a strategic moment to add to your position at a lower price.
The decision to invest today hinges on your risk appetite and time horizon. The data points to a stock at a potential inflection point, balancing a steep daily drop against a reasonable valuation and signs of an early morning recovery.
Disclaimer: This article is for informational purposes only and does not constitute financial advice. Consult with a professional financial advisor before making any investment decisions.


