
Tesla Inc. (TSLA) is showing significant bullish momentum, closing the previous session with strong gains and continuing that trajectory in pre-market trading. For traders analyzing the Tesla stock, the current data provides critical levels and signals that could dictate the day’s strategy. This article breaks down everything a trader needs to know.
Yesterday’s Strong Performance: A Bullish Engulf
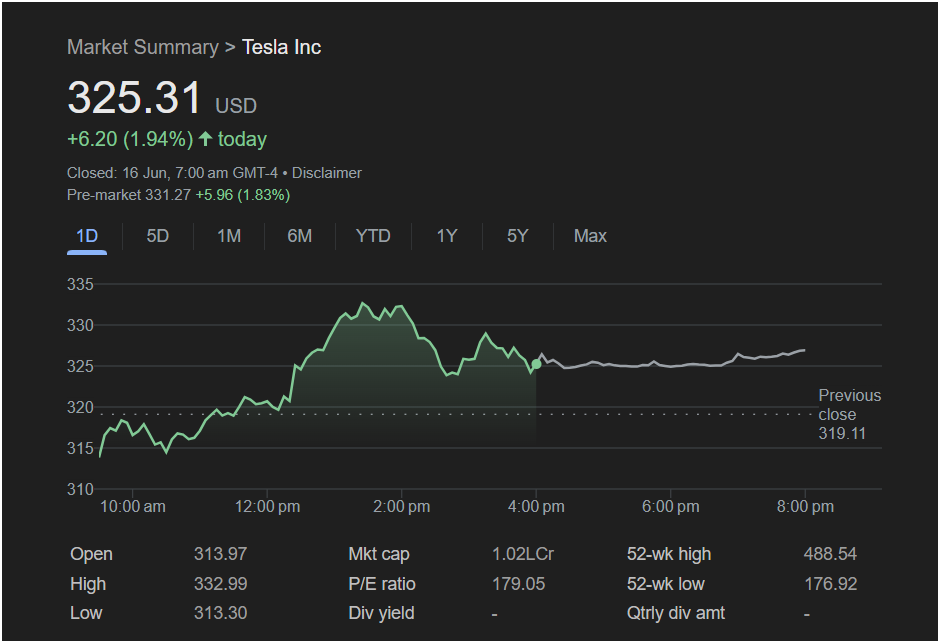
The market data from the last trading session on June 16th reveals a day dominated by buyers:
-
Closing Price: 325.31 USD
-
Daily Gain: The stock surged by +6.20 points, a substantial 1.94% increase.
-
Intraday Action: The stock opened at 313.97, near its low of 313.30, and then embarked on a powerful rally throughout the morning, peaking at an intraday high of 332.99. Although it pulled back from this peak, it managed to hold a significant portion of its gains, closing strong.
This price action, where the stock opens low and closes high, well above the previous close of 319.11, indicates strong buying pressure and positive market sentiment.
 Pre-Market Signals: Continued Upward Drive
The positive sentiment is clearly carrying over into the next session, as evidenced by the pre-market data:
-
Pre-Market Price: 331.27 USD
-
Pre-Market Gain: A further increase of +5.96 (1.83%)
This robust pre-market activity suggests that Tesla stock is likely to open with a significant “gap up,” starting the trading day near the previous session’s high. This is a powerful continuation signal that traders will be watching closely.
Key Financial Metrics for a Broader View
Understanding the company’s valuation and market position is crucial for any trading decision:
-
Market Cap: 1.02L Cr (equivalent to 1.02 Trillion USD), cementing its place as a mega-cap leader.
-
P/E Ratio: At 179.05, the Price-to-Earnings ratio is extremely high, reflecting market expectations of significant future growth rather than current earnings. This is a key characteristic of growth stocks like Tesla.
-
52-Week Range: The stock’s price has fluctuated between a low of 176.92 USD and a high of 488.54 USD. The current price action is pushing away from the midpoint of this range, showing renewed strength.
-
Dividend Yield: Tesla does not currently pay a dividend, reinvesting its capital into growth.
Trader’s Outlook: Is It Right to Invest Today?
The data points to a strong bullish bias, but traders must remain strategic.
The Bullish Case (Reasons for Optimism):
-
A powerful closing gain of nearly 2%.
-
Very strong pre-market performance, indicating a gap-up open is likely.
-
The price action decisively broke and closed above the previous day’s close (319.11).
The Bearish Case (Points of Caution):
-
The stock failed to hold its intraday high of 332.99, pulling back about $7 before the close. This level will now serve as a formidable resistance.
-
The extremely high P/E ratio can make the stock susceptible to sharp corrections if growth expectations are not met.
Key Levels to Monitor:
-
Immediate Resistance: The previous day’s high of 332.99. This is the single most important level to watch at the open. A decisive break and hold above this price could trigger a further rally.
-
Immediate Support: The pre-market price around 331.27. Below that, the previous closing price of 325.31 will act as a significant support zone.
-
Major Support: The previous close of 319.11. A drop below this level would negate the recent bullish breakout.
:
For a momentum trader, the current setup for Tesla stock is very attractive. The combination of a strong close and even stronger pre-market activity suggests the path of least resistance is upwards. The key will be whether the stock can overcome the $333 resistance area.
A prudent approach would be to watch the opening price action. A strong open above $333 could be a clear buy signal for short-term traders. However, if the stock opens strong but fails to hold above this level, it could indicate exhaustion and a potential for a pullback to test support levels. Given the volatility, disciplined use of stop-loss orders is essential.
Disclaimer: This article is for informational purposes only and is based on the data provided in the image. It does not constitute financial advice. Stock market trading involves significant risk, and you should conduct your own research and consult with a qualified financial advisor before making any investment decisions.


