
Chevron Corp (NYSE: CVX), a cornerstone of the energy sector, is presenting a complex picture for traders today. While the stock is technically in the green, a closer look at the intraday price action reveals significant selling pressure after a strong opening. For investors and traders, understanding these conflicting signals is key to making a strategic move. This article will dissect all the available data for Chevron stock.
Current Market Snapshot
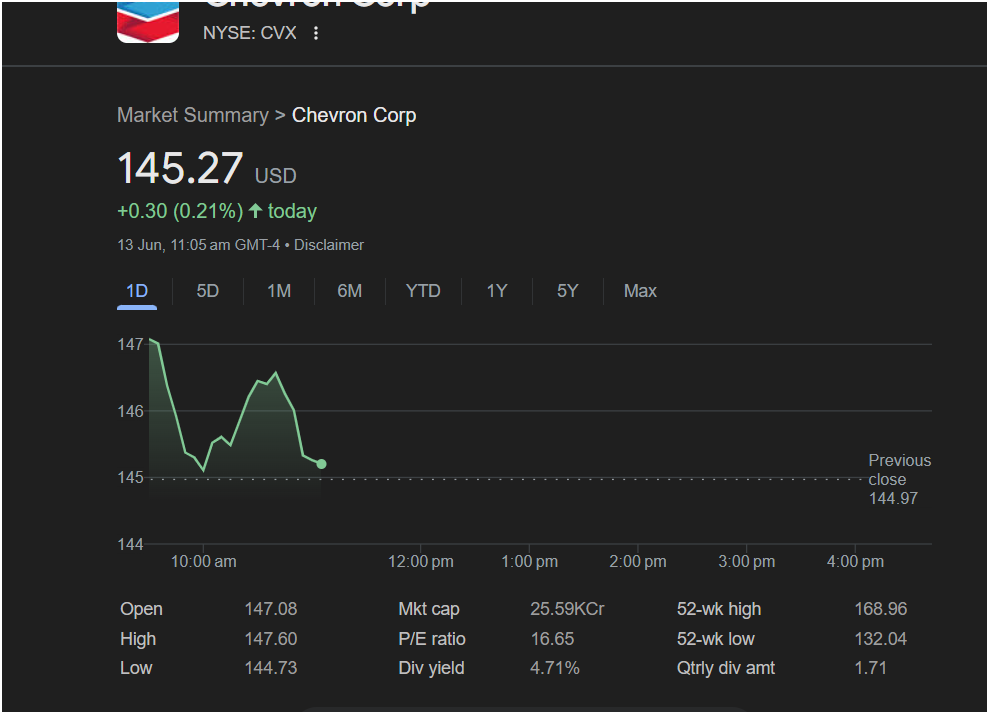
As of 11:05 am GMT-4 on June 13th, the market data for Chevron is as follows:
-
Current Price: 145.27 USD
-
Today’s Change: Up +0.30 USD, representing a modest +0.21% increase.
On the surface, this appears to be a quiet day. However, the intraday chart tells a much more bearish story.
 Intraday Price Action and Chart Analysis
The 1-Day (1D) chart shows a classic “gap up and fade” pattern, which is often a sign of underlying weakness.
-
Previous Close: The stock closed yesterday at 144.97 USD.
-
Open: Chevron gapped up significantly at the open, starting the session at 147.08 USD.
-
Intraday High and Low: The stock pushed to a high of 147.60 USD shortly after the open before sellers took control, driving the price down to a low of 144.73 USD.
-
Chart Pattern: After the initial spike, the stock has been in a steady decline. Critically, it has fallen below the previous day’s close, erasing all of its opening gains and more. The current price of 145.27 USD is hovering just above the day’s low, indicating that sellers have dominated the session so far.
This pattern suggests that the initial optimism was quickly met with profit-taking or short-selling, a bearish signal for short-term traders.
Key Financial Metrics for Traders
Chevron’s financial metrics position it as a classic value and income play:
-
P/E Ratio: 16.65 – A Price-to-Earnings ratio in this range is considered reasonable for a mature, blue-chip company in the energy sector. It suggests the stock is not overvalued based on its current earnings.
-
Dividend Yield: 4.71% – This is a very strong dividend yield, making Chevron an attractive holding for income-focused investors. This high yield can often provide a floor of support for the stock price.
-
Quarterly Dividend Amount: 1.71 USD – The substantial quarterly payout underpins the high yield.
-
52-Week High/Low: 168.96 / 132.04 USD – The current price is in the lower half of its 52-week range, indicating that the stock has been under pressure over the medium term and has not participated in some of the broader market rallies.
Is it Right to Invest Today? An Analytical Perspective
Here is a summary of the conflicting signals for trader consideration. This is not financial advice.
Bullish Signals (Reasons for Optimism):
-
High Dividend Yield: The 4.71% yield offers a compelling return and can attract long-term, value-oriented buyers, potentially limiting downside.
-
Reasonable Valuation: A P/E ratio of 16.65 suggests the stock is not excessively priced.
Bearish Signals (Reasons for Caution):
-
Gap Up and Fade: The failure to hold opening gains is a significant intraday sign of weakness.
-
Trading Below Previous Close: The stock has given up its positive momentum and is now trading below a key technical level.
-
Proximity to Day’s Low: The price is struggling near its lowest point of the session, indicating sellers are in control.
-
Position in 52-Week Range: Trading in the lower half of its annual range points to medium-term weakness.
for a Trader:
Despite being nominally up, the price action for Chevron stock (CVX) today is bearish. The inability to sustain the strong opening is a red flag for short-term momentum. The primary battle is now occurring around the previous day’s close (144.97) and the day’s low (144.73).
A break and close below 144.73 could signal a continuation of the downtrend. For long-term investors, the high dividend yield remains a key attraction, but short-term traders should be wary of the current negative momentum.
Disclaimer: This article is for informational purposes only and is based on the data from the provided image. It does not constitute financial advice. All traders should conduct their own research and analysis before making any investment decisions.


