Investing in XP Inc. (NASDAQ: XP) Stock Today: A Trader’s Perspective

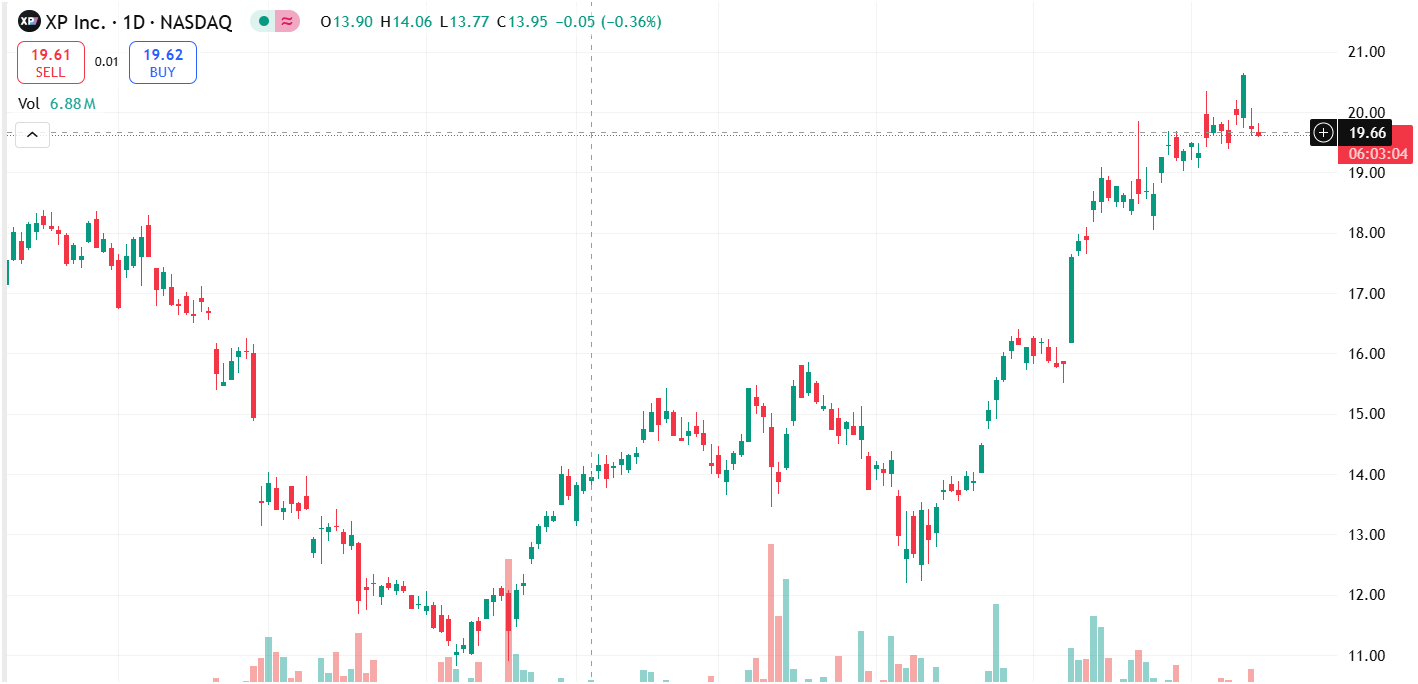
As of the current observation (indicated by the candlestick at the far right of the chart), XP Inc. (NASDAQ: XP) stock is showing a slight decline today. The current price is around $19.66, with the last recorded change being -$0.05 (-0.36%). The stock opened at $19.90, reached a high of $20.06, and a low of $19.60 so far today.
Here’s a breakdown of what a trader needs to know:
Current Market Snapshot (Intraday):
- Current Price (Approximate): $19.66
- Today’s Change (Approximate): -$0.05 (-0.36%)
- Today’s Open: $19.90
- Today’s High: $20.06
- Today’s Low: $19.60
- Volume: 6.88 Million (This is the total volume for the day so far, indicating trading activity.)
 Key Observations from the Chart (1-Day Candlestick Chart):
- Recent Uptrend: Looking at the past few months, XP Inc. stock has been on a significant uptrend, recovering strongly from lows earlier in the year (around $11-$12).
- Recent Peak: The stock recently peaked above $20.00, reaching highs not seen in a considerable period.
- Current Day’s Performance (Red Candlestick): Today’s candlestick is red, indicating that the closing/current price is lower than the opening price. The presence of a long upper shadow suggests that the stock attempted to move higher but faced resistance and was pushed down. The lower part of the candlestick is also relatively low, indicating selling pressure.
- Volume: While the total volume for today is 6.88 million, it’s important to compare this to recent daily volumes. A high volume on a down day could signify strong selling pressure.
Is it Right to Invest Today? A Trader’s Assessment:
Whether it’s “right” to invest in XP Inc. stock today depends heavily on a trader’s strategy, risk tolerance, and time horizon.
- For Short-Term/Day Traders:
- Bearish Signal (Short-Term): The current red candlestick, especially with an upper wick indicating rejection of higher prices, suggests short-term bearish sentiment. It shows that buyers are not currently able to sustain prices above $20.00.
- Potential Pullback: After a strong uptrend, a pullback or consolidation is common. Today’s action might be the beginning of such a correction.
- Entry Points: Aggressive traders might consider shorting if they believe the downtrend will continue, or wait for further dips to identify a potential buying opportunity at a lower support level.
- Resistance at $20: The price point of $20.00 appears to be a short-term resistance level, as the stock struggled to stay above it.
- For Swing Traders:
- Watch for Support: Swing traders might wait to see where the stock finds support after this recent dip. Key support levels from previous price action should be identified.
- Trend Confirmation: While the longer-term trend is up, a clear reversal or continuation pattern would be sought before initiating a new swing trade.
- For Long-Term Investors:
- Evaluation of the Business: Long-term investors should not base decisions solely on one day’s price action. They need to analyze XP Inc.’s fundamentals: its financial performance, growth prospects in the Brazilian financial market, competitive landscape, and management.
- Discounted Entry? If a long-term investor believes in XP’s future, a short-term dip could be seen as an opportunity to buy the stock at a slightly lower price, but only after fundamental research supports the investment thesis.
- High Valuation: After a significant run-up, investors should assess if the current valuation is still attractive relative to future earnings potential.
Information Every Trader Needs:
- Fundamental Analysis (Beyond this chart):
- Company Overview: What does XP Inc. do? (It’s a leading financial services company in Brazil.)
- Financial Health: Review their revenue, net income, balance sheet, and cash flow statements.
- Growth Drivers: What are the key drivers for their future growth? (e.g., expansion into new services, increasing client base, market share gains.)
- Competitive Landscape: Who are their main competitors, and what is their competitive advantage?
- Economic Environment: How does the Brazilian economy and regulatory environment impact their business?
- Technical Analysis (More In-Depth):
- Support & Resistance Levels: Identify key price levels where the stock has historically found buyers (support) or sellers (resistance). The $20 mark seems to be a current resistance.
- Moving Averages: Analyze where the stock is trading relative to its 50-day, 100-day, or 200-day moving averages to confirm the trend.
- Chart Patterns: Look for patterns like flags, pennants, head and shoulders, etc., that might signal future price movements.
- Volume Analysis: Pay close attention to volume alongside price action. High volume on a down move can be more significant than low volume.
- Relative Strength Index (RSI) or MACD: These indicators can help identify if the stock is overbought or oversold.
- News & Catalysts:
- Any recent company announcements? Earnings reports? Analyst upgrades/downgrades?
- Macroeconomic news impacting emerging markets or the financial sector in Brazil.
- Risk Management:
- Stop-Loss Orders: Crucial for short-term traders to limit potential losses.
- Position Sizing: Determine how much capital to allocate to this trade based on your risk tolerance.
- Diversification: Do not put all your capital into one stock.
for Today:
XP Inc. stock is experiencing a slight pullback today after a strong run-up. For a short-term trader, this suggests caution or a potential shorting opportunity if the selling pressure continues. For long-term investors, today’s dip might offer a slightly better entry point, but only if robust fundamental analysis supports the investment thesis. It is crucial to conduct further research beyond just this chart before making any investment decision.
Disclaimer: This information is for educational and informational purposes only, and does not constitute financial advice.1 Investing in the stock market involves substantial2 risks, and you could lose money. Always perform your own due diligence or consult with a qualified financial advisor before making any investment decisions.


