
Shopify Inc. (NYSE: SHOP) ended the trading week in a state of perfect equilibrium, leaving investors and traders to ponder its next move. As the market closed on Friday, June 23rd, Shopify stock settled at $106.40 USD, posting a change of exactly $0.00 (0.00%). This flat close masks a day of volatility and sets up a critical start to the upcoming week.
For those considering an investment, a deep dive into Friday’s performance and key metrics is essential to gauge whether the stock is poised for a breakout or a breakdown.
Friday’s Trading in Review
The “1D” chart reveals a story of an early-session struggle followed by a late-day recovery attempt.
-
Initial Weakness: The stock began the day on a weaker footing, dropping from opening highs near $108.50 and trending downwards for most of the morning and early afternoon.
-
Finding a Floor: A significant level of support appeared to form around the $106.00 mark, which the stock tested multiple times before finding its footing.
-
Late-Day Spike: A notable surge occurred around 4:50 PM (16:50), where the price briefly jumped to $107.00. However, it couldn’t sustain this momentum and pulled back to close at its previous day’s level.
This price action suggests a battle between buyers and sellers, resulting in a stalemate. The flat close signifies market indecision, which often precedes a more significant price movement.
Key Financial Metrics for Traders
A look at the underlying data provides crucial context for any investment decision:
-
Market Capitalization: 13.80KCr.
-
P/E Ratio: A high 86.35 indicates that investors have high growth expectations for Shopify. While common for tech and growth stocks, a high P/E ratio can also signal that a stock is overvalued and can lead to higher volatility.
-
52-Week Range: The stock is currently trading at
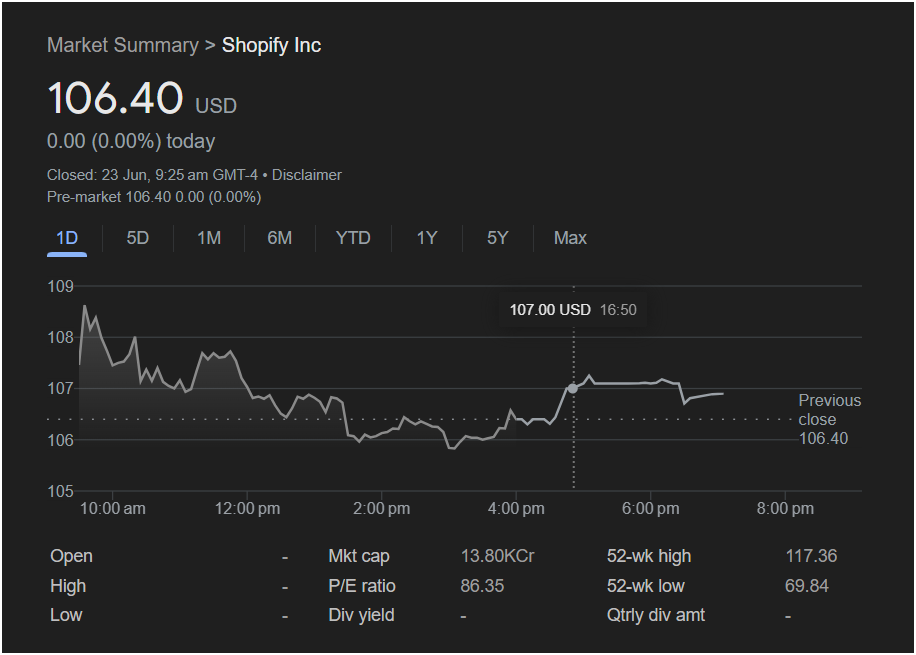
117.36** than its 52-week low of $69.84. This suggests the stock has seen significant recovery and positive momentum over the past year.
-
Dividends: Shopify does not currently offer a dividend, meaning returns for investors are solely dependent on capital gains from the stock’s price appreciation.
Will Shopify Stock Go Up or Down on Monday?
Based on the chart, here is the analysis for Monday’s trading session:
It is not advisable to make a definitive investment decision based solely on one day’s chart, but we can identify key technical levels that will likely dictate the direction of Shopify stock on Monday.
-
Bullish Case (Potential for an Upswing): If buyers take control, the first level of resistance to watch is the late-day high of
108.50. Positive pre-market activity on Monday would be a strong indicator of this potential.
-
Bearish Case (Potential for a Downswing): If sellers dominate, the critical support level is $106.00. This level held firm throughout the afternoon on Friday. A definitive break below this price point could signal further weakness and open the door to a deeper pullback.
: Is it Right to Invest Today
Shopify stock is currently at a pivotal inflection point. The 0.00% close signifies indecision, and the stock could make a strong move in either direction at the start of the week.
For a trader, the best course of action is to watch the key levels on Monday. An investment decision should be based on whether the stock can decisively break above the $107.00 resistance or falls below the $106.00 support. For long-term investors, the high P/E ratio and position within the 52-week range are important factors to consider in the context of their overall portfolio strategy and risk tolerance. As always, broader market sentiment and any company-specific news will also play a crucial role in the stock’s performance.


