
Berkshire Hathaway Inc. Class A (BRK.A), the high-value stock helmed by legendary investor Warren Buffett, finished Tuesday’s trading session in positive territory, giving investors reasons for optimism. However, a closer look at the intraday chart reveals a more complex battle between buyers and sellers. This analysis breaks down the essential data from June 18th to provide a clear outlook for what traders can expect next.
A Day of Gains Marked by Volatility
Berkshire Hathaway’s Class A stock closed the day at a staggering
2,800.00 (+0.39%). The day’s trading, however, was a rollercoaster.
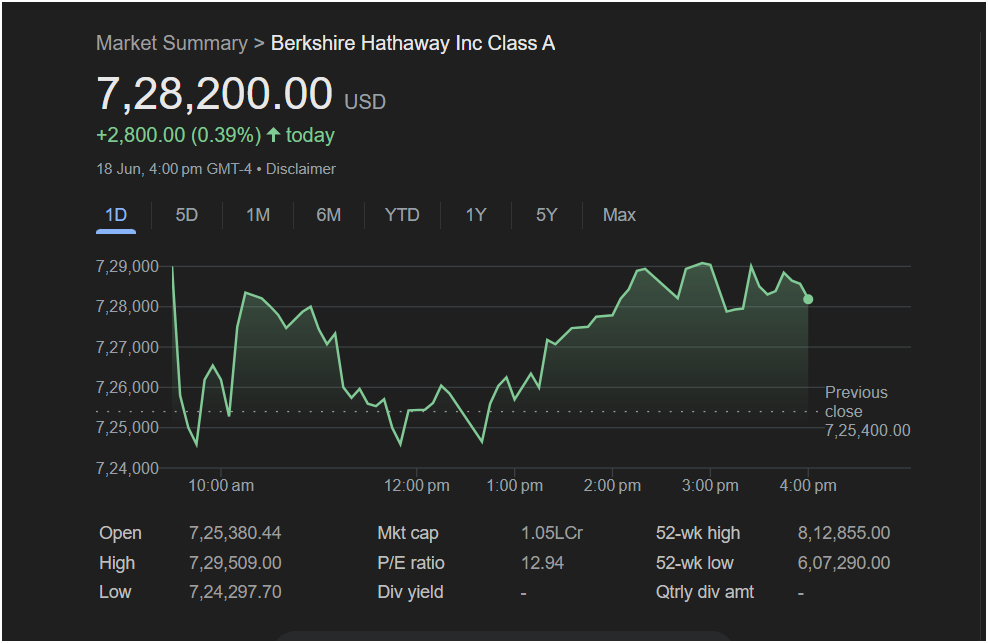 The stock opened at $725,380.44, just below the previous close of
724,297.70** before mounting a powerful morning rally that pushed the price to its session high of $729,509.00. Following this peak, the stock pulled back and traded sideways for a couple of hours. A second wave of buying interest emerged in the afternoon, but the stock couldn’t surpass its earlier high, eventually settling down to its closing price. The pullback in the final hour suggests some investors took profits off the table before the bell.
Essential Metrics for Your Watchlist
A comprehensive trading decision requires looking at the fundamental data provided:
-
P/E Ratio (12.94): This is a standout metric. A Price-to-Earnings ratio this low for a blue-chip company like Berkshire Hathaway is exceptionally rare and suggests the stock may be undervalued compared to its earnings. This is a powerful signal for value investors.
-
Market Cap (1.05L Cr / ~$900 Billion): As a mega-cap behemoth, BRK.A is a cornerstone of the market. Its movements are significant but it is less prone to the wild swings of smaller stocks.
-
52-Week Range ($607,290.00 – $812,855.00): The current price sits firmly in the upper half of its yearly range. While not at its peak, it has recovered significantly from its lows, indicating strong underlying health.
-
Dividend Yield (-): True to form, Berkshire Hathaway does not pay a dividend. The company’s long-standing strategy is to reinvest all profits back into the business to generate greater long-term value for shareholders.
Analysis: Will the Stock Rise or Fall?
The data from Tuesday presents a compelling, albeit mixed, picture for the next trading day.
The Bullish Case (Why it Might Go Up):
-
Attractive Valuation: The extremely low P/E ratio of 12.94 is the strongest bullish signal, suggesting the stock is cheap relative to its profit-generating power.
-
Positive Close: The stock ended the day with a substantial $2,800 gain, showing that buyers were ultimately in control.
-
Strong Support: The stock successfully bounced off its intraday low, indicating a solid support level near the $724,000 mark.
The Bearish Case (Why Caution is Warranted):
-
Failure at the High: The inability to hold or surpass the day’s high of $729,509 indicates a significant resistance level. Sellers emerged at this point to cap the rally.
-
End-of-Day Weakness: The slide from the afternoon peak into the close shows that momentum was fading as the session ended. This could carry over and lead to a weaker open.
The Verdict: Is It a Good Day to Invest?
For long-term value investors, the low P/E ratio makes Berkshire Hathaway an attractive proposition at these levels. The core investment thesis for BRK.A is often measured in years, not days, and from that perspective, the current valuation is compelling.
For short-term traders, the situation is more nuanced. The key is to watch the price action around critical levels at the market open.
-
Resistance to Watch: The day’s high of $729,509.00. A definitive break above this level on strong volume would be a very bullish signal.
-
Support to Watch: The day’s low of $724,297.70. If the stock breaks below this level, it could signal a short-term trend reversal and further downside.
In summary, Berkshire Hathaway stock presents a classic “value vs. momentum” scenario. The fundamental value is strong, but short-term momentum showed signs of exhaustion. Prudent traders may wait for a confirmed break of resistance or a dip toward support before entering a new position.
: This article is for informational purposes only and is based on an analysis of the provided image. It does not constitute financial advice. All investment decisions carry risk, and you should conduct your own research or consult with a qualified financial advisor before making any trades.


