
Oracle Corp. stock faced intense selling pressure on Thursday, June 20th, closing with a significant loss and signaling potential further downside for the coming trading week. The stock’s sharp rejection from near its 52-week high has put traders on high alert, with key support levels now in focus.
For anyone considering an investment or trade in Oracle on Monday, a detailed analysis of Thursday’s price action is essential. This article covers all the information a trader needs from the latest market summary.
Thursday’s Session Unpacked: A Bearish Trend
Oracle closed the main trading day at
5.70, or 2.70%. The bearish sentiment was persistent throughout the session and even bled into post-market trading, where the stock slipped further to
0.24 (0.12%).
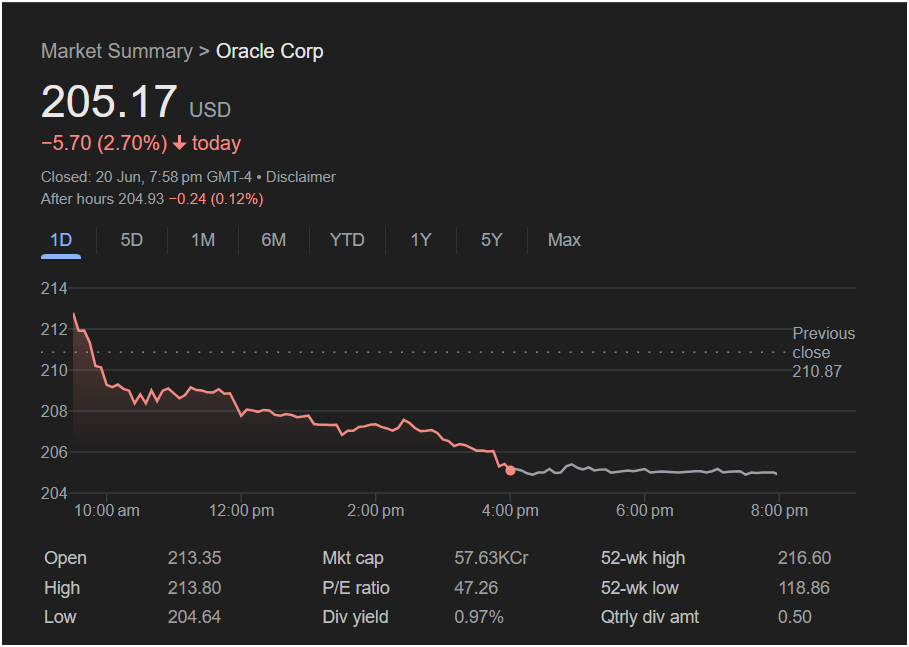
The intraday chart tells a clear story of seller dominance. The stock opened at $213.35 and briefly touched a high of $213.80, just shy of its 52-week high. This attempt to push higher was decisively rejected, triggering a sustained sell-off that lasted the entire day. The stock methodically carved out lower lows, eventually bottoming out at $204.64 before closing. The lack of any significant bounce indicates that buyers were largely absent.
Key Metrics at a Glance: A Trader’s Checklist
Understanding the following data points is critical for assessing Oracle’s current position:
-
Closing Price: $205.17
-
Day’s Range: $204.64 (Low) to $213.80 (High)
-
Previous Close: $210.87
-
52-Week Range: $118.86 to $216.60
-
P/E Ratio: 47.26
-
Dividend Yield: 0.97%
The most telling metric here is the day’s high of $213.80 in relation to the 52-week high of $216.60. The failure to break out, followed by a sharp reversal, is a classic bearish signal that traders will watch closely.
Will the Market Go Up or Down on Monday?
The evidence from Thursday’s session points heavily towards a continued bearish outlook, though a technical bounce is always possible.
The Bearish Case (Market Down):
This is the stronger argument based on the data. The stock experienced a strong rejection from a key resistance zone (near the 52-week high). The sell-off was consistent, with the price closing near the day’s low. The additional drop in after-hours trading confirms this negative momentum. On Monday, traders will be watching the day’s low of $204.64 as the first critical support level. A break below this could trigger further selling.
The Bullish Case (Market Up):
The bullish case is significantly weaker but worth considering. After a steep 2.70% drop, the stock might be seen as oversold in the very short term, potentially leading to a “dead cat bounce” or a relief rally. Long-term investors might also see this dip as a buying opportunity, given that the stock is still trading in the upper end of its 52-week range. However, for a bullish trend to resume, buyers would need to decisively reclaim significant levels, such as the $208 mark where the stock briefly consolidated.
: Is It Right to Invest Today?
Based on the overwhelming bearish momentum from Thursday, initiating a new long position at the market open on Monday would be a high-risk strategy. The path of least resistance currently appears to be downwards.
Traders should adopt a cautious approach and watch these key levels:
-
A break below the day’s low of $204.64 would confirm the continuation of the downtrend.
-
For any sign of a reversal, buyers would need to push the price back above the $206 level and begin challenging higher resistance points.
The sell-off on Thursday was definitive. How Oracle stock reacts to its newly established low will be the most important tell for its direction in the coming week.
Disclaimer: This article is for informational purposes only and is based on the analysis of a provided image. It does not constitute financial advice. Stock market trading involves significant risk, and you should conduct your own research or consult with a qualified financial advisor before making any investment decisions.


