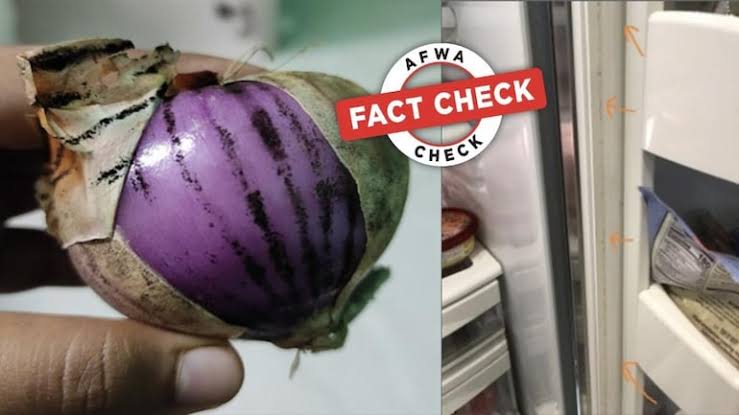
Microsoft Stock Analysis: Is MSFT Poised for a Rise Today

Microsoft Corp (MSFT) stock is in the spotlight as traders gear up for the market open, with pre-market data suggesting a potential continuation of its recent upward momentum. After a strong trading session that saw the stock close firmly in the green, all eyes are on whether it can breach its recent highs. This analysis breaks down the key data points every trader needs to know before making a move.
A Closer Look at the Numbers
Based on the latest available data, here is a summary of Microsoft’s stock performance:
-
Last Closing Price: $490.11 USD
-
Day’s Gain: +$4.11 (+0.85%)
-
Pre-Market Price: **
1.24 or 0.25%)
-
Previous Day’s Close: $486.00
-
Day’s Trading Range: $486.80 (Low) to $491.85 (High)
-
52-Week Range: $344.79 (Low) to $491.85 (High)
-
Market Cap: Approximately $3.64 Trillion
-
P/E Ratio: 37.88
Technical Picture: Momentum and Key Levels to Watch
The one-day chart (1D) paints a clear picture of bullish sentiment. The stock opened at $488.95 and, after a brief dip to its low of
491.85** around midday. This peak matches the stock’s 52-week high, making it a critical resistance level.
The positive pre-market activity, pushing the stock to $491.35, indicates that buying interest has carried over. For today’s session, traders should watch these key levels:
-
Resistance: The $491.85 mark is the most important level to watch. A decisive break and hold above this 52-week high on strong volume could signal a further bullish run, as it would put the stock in new all-time high territory.
-
Support: If the stock faces rejection at the resistance level, the first line of support would likely be around the previous closing price of
488.95.
Trader Outlook: Should You Invest Today?
The Bullish Case:
The current momentum is undeniably positive. The strong close, followed by a gap up in pre-market trading, suggests that investor confidence in Microsoft is high. The company’s massive market cap and solid fundamentals provide a strong backbone, and breaking a 52-week high is often a very bullish technical signal.
The Case for Caution:
While the outlook is optimistic, trading at a 52-week high comes with risks. This level can act as a psychological barrier, potentially triggering profit-taking from investors who bought at lower prices. The P/E ratio of 37.88, while not extreme for a tech giant, suggests that high expectations for future growth are already priced into the stock. A failure to break the $491.85 resistance could lead to a short-term consolidation or pullback.
Conclusion:
For a trader today, the decision to invest in Microsoft stock hinges on its ability to overcome the $491.85 resistance level.
-
An aggressive strategy would be to watch for a strong open and a confirmed break above this level before considering a long position.
-
A more conservative approach would be to wait and see if the level holds as new support after a breakout, or to look for a potential entry on a slight dip towards the support levels mentioned above.
Given the positive sentiment, the path of least resistance appears to be upward, but confirmation at the opening bell will be crucial.
Disclaimer: This article is for informational and analytical purposes only, based on the data provided in a single screenshot. It is not financial advice. All investment decisions should be made after conducting your own thorough research and consulting with a qualified financial advisor. Stock markets are volatile, and past performance is not indicative of future results.