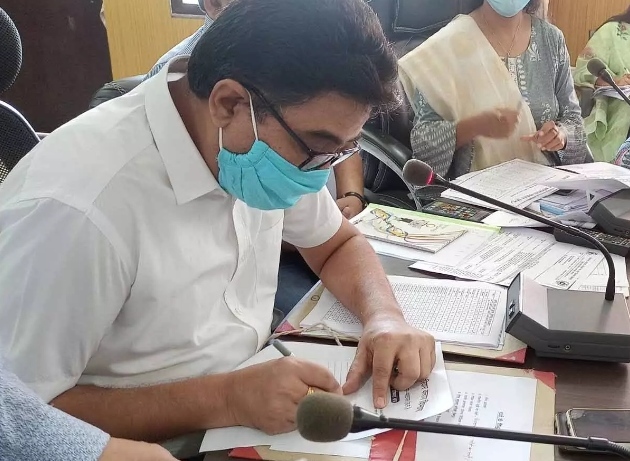
News

Palantir Stock (PLTR) Surges: A Trader’s Look at Today’s Bullish Breakout

Palantir Technologies Inc. (NASDAQ: PLTR) is capturing significant attention today with a strong upward move, signaling robust bullish momentum in the early trading session. For traders monitoring this popular tech stock, understanding the current price action and key metrics is vital for navigating the day’s opportunities. This article breaks down all the critical data from the market summary for Palantir stock.

Current Market Snapshot

As of 11:00 am GMT-4 on June 13th, Palantir is demonstrating considerable strength:

  • Current Price: 137.93 USD

  • Today’s Change: A substantial gain of +2.74 USD, which is a +2.03% increase.

This positive performance indicates strong buying interest and has pushed the stock well above its previous closing price.

Intraday Price Action and Chart Analysis

The 1-Day (1D) chart for Palantir stock shows a classic “dip and rip” pattern, where an initial dip was aggressively bought, leading to a strong rally.

  • Previous Close: The stock ended the last session at 135.19 USD.

  • Open: It opened lower at 133.82 USD and briefly dipped to the day’s low.

  • Intraday High and Low: The stock hit a low of 133.35 USD before buyers stepped in and drove the price up to a high of 138.69 USD.

  • Chart Pattern: The W-shaped recovery from the morning low is a powerful bullish signal. The stock has decisively broken through the previous day’s closing price and is now trading near its intraday high, suggesting that buyers are firmly in control.

The key level to watch now is the day’s high of 138.69 USD. A sustained break above this could signal further upside.

Key Financial Metrics for Traders

A deeper look at Palantir’s financial data reveals important context for its valuation and long-term trend:

  • P/E Ratio: 603.30 – This is an extremely high Price-to-Earnings ratio. It signifies that investors have priced in massive future earnings growth. While common for high-growth tech companies, this valuation makes the stock highly sensitive to any changes in growth expectations or market sentiment.

  • 52-Week High/Low: 139.75 / 21.23 USD – This range is a testament to the stock’s phenomenal performance over the past year. The current price is just shy of its 52-week high, which is a very strong bullish indicator. A breakout above 139.75 USD would mark a new milestone.

  • Dividend Yield: – Palantir does not pay a dividend, reinforcing its status as a pure-play growth stock. Investors are focused on capital appreciation rather than income.

  • Market Cap: 32.43KCr – While the “KCr” format is unusual for a US stock, Palantir is a large-cap technology company with a market capitalization in the tens of billions of dollars.

Is it Right to Invest Today? An Analytical Perspective

Based on this data, here is a strategic summary for traders. This is not financial advice.

Bullish Signals (Reasons for Optimism):

  • Strong intraday momentum with a gain of over 2%.

  • The stock is trading very close to its 52-week high, a sign of a powerful uptrend.

  • The recovery from the morning low shows resilient buying pressure.

  • It has clearly broken above the resistance of the previous day’s close.

Bearish Signals (Reasons for Caution):

  • The astronomically high P/E ratio suggests the stock is fundamentally very expensive and carries significant valuation risk.

  • The 52-week high of 139.75 USD could act as a strong psychological and technical resistance level where sellers may emerge.

for a Trader:

The sentiment for Palantir stock (PLTR) is unequivocally bullish today. The strong buying pressure and proximity to its 52-week high are compelling signals for momentum traders. The immediate challenge is to break and hold above the day’s high (138.69 USD) and the subsequent 52-week high (139.75 USD).

A trader might consider this a potential breakout opportunity, but should remain extremely cautious due to the high valuation. Support can now be found at the previous close of 135.19 USD. A failure to hold this level could see momentum stall.


Disclaimer: This article is for informational purposes only and is based on the data from the provided image. It does not constitute financial advice. All traders should conduct their own research and analysis before making any investment decisions.

Back to top button
close