
This NVIDIA stock (NVDA) analysis provides a detailed look at the company’s recent performance and what traders should watch for in today’s session. After a significant drop in the previous trading day, pre-market activity suggests a potential shift in momentum. We will break down the key data points, technical levels, and fundamental metrics from the chart to help you make an informed decision.
Yesterday’s Market Performance: A Recap
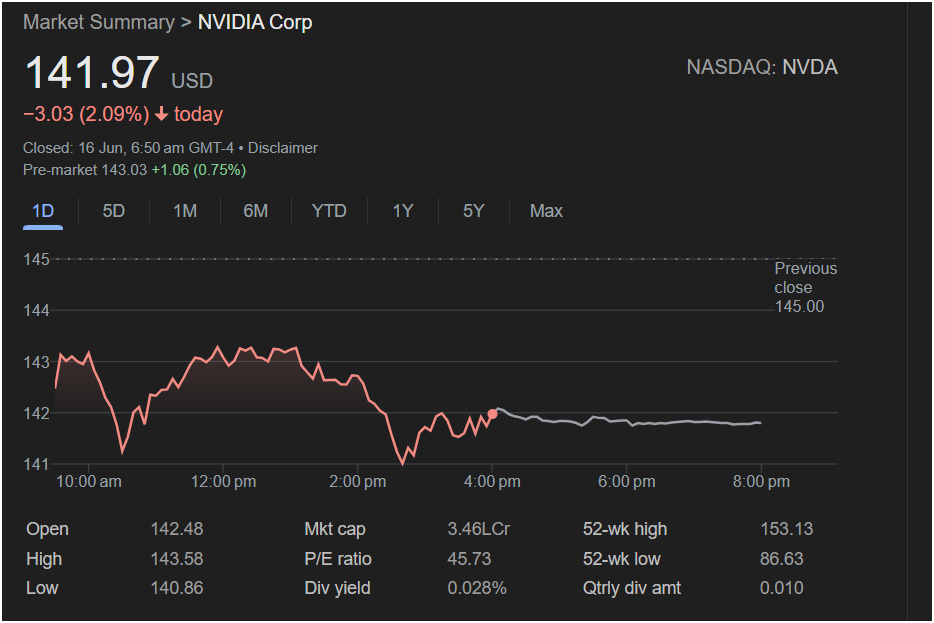
Based on the provided 1-day chart, NVIDIA had a challenging trading session.
-
Closing Price: The stock closed at 141.97 USD.
-
Daily Change: It finished the day down -3.03 points, a loss of 2.09%.
-
Intraday Trend: The stock opened at 142.48, reached a high of 143.58, but faced significant selling pressure, pushing it to a low of 140.86 before closing. This shows that sellers were in control for most of the day, particularly in the afternoon.
-
Previous Close: The stock fell from a previous close of 145.00, indicating a gap down or immediate selling at the market open.
Today’s Outlook: Pre-Market Signals
The most critical piece of information for today’s session is the pre-market data:
-
Pre-Market Price: 143.03
-
Pre-Market Change: Up +1.06 (0.75%)
This positive pre-market activity indicates that buyers are stepping in before the market opens, looking to capitalize on the previous day’s drop. This suggests the stock may open higher and attempt to recover some of its recent losses.
 Key Technical Levels for Traders to Watch
For today’s trading session, the following price levels are critical:
-
Immediate Support: The previous day’s low of $140.86. If the stock price breaks below this level, it could signal a continuation of the bearish trend.
-
Immediate Resistance: The pre-market price around
143.58 will act as the first major hurdles. A strong move above this zone could give buyers more confidence.
-
Key Resistance: The previous close of $145.00 is the most significant short-term resistance. Reclaiming this level would be a strong bullish signal, as it would close the gap from the prior day’s sell-off.
Fundamental Snapshot
The image also provides key financial metrics for a more complete picture:
-
Market Cap: 3.46LCr (This notation, likely Lakh Crore, suggests a market capitalization in the hundreds of billions of USD, confirming NVIDIA as a large-cap stock).
-
P/E Ratio: 45.73. This is a relatively high P/E ratio, indicating that investors have high expectations for future growth.
-
52-Week Range: The stock is trading between a low of 86.63 and a high of 153.13. At 141.97, it’s closer to its yearly high, suggesting a strong long-term uptrend despite the recent pullback.
-
Dividend Yield: 0.028%. This is a very low yield, confirming that NVIDIA is a growth stock, not an income-generating one.
Is It a Good Day to Invest in NVIDIA Stock?
Disclaimer: This article is for informational purposes only and should not be considered financial advice. Investing in the stock market carries risks.
Based on the data, here is an analysis for different trading strategies:
-
For Day Traders: The conflict between yesterday’s bearish close and today’s bullish pre-market creates a volatile setup. A day trader might look for a long entry if the stock can decisively break and hold above the initial resistance levels ($143.58). Conversely, a failure to break resistance could present a shorting opportunity, targeting the support at $140.86.
-
For Swing Traders: The stock is in a short-term downtrend. A swing trader might wait for more confirmation of a reversal. A close above the key resistance of $145.00 would be a much stronger signal to enter a long position for a multi-day hold.
-
For Long-Term Investors: One bad day is rarely a concern for a long-term strategy. This dip could be viewed as a buying opportunity if you believe in NVIDIA’s long-term dominance in AI, gaming, and data centers. However, the high P/E ratio is a factor to consider, as it means the stock is priced for significant growth.
In summary, NVIDIA stock is at a pivotal point. While yesterday was clearly bearish, pre-market strength offers hope for a recovery. Traders should closely monitor the key support and resistance levels outlined above to gauge the market’s direction for the day.


