
NEW YORK – S&P Global Inc. (SPGI) stock has ended the week on a knife’s edge, closing at $501.49 after a day of intense volatility. While the closing price was unchanged from the previous day, the intraday chart tells a story of a fierce battle between buyers and sellers, leaving traders to question whether the stock is poised for a breakout or a breakdown come Monday morning.
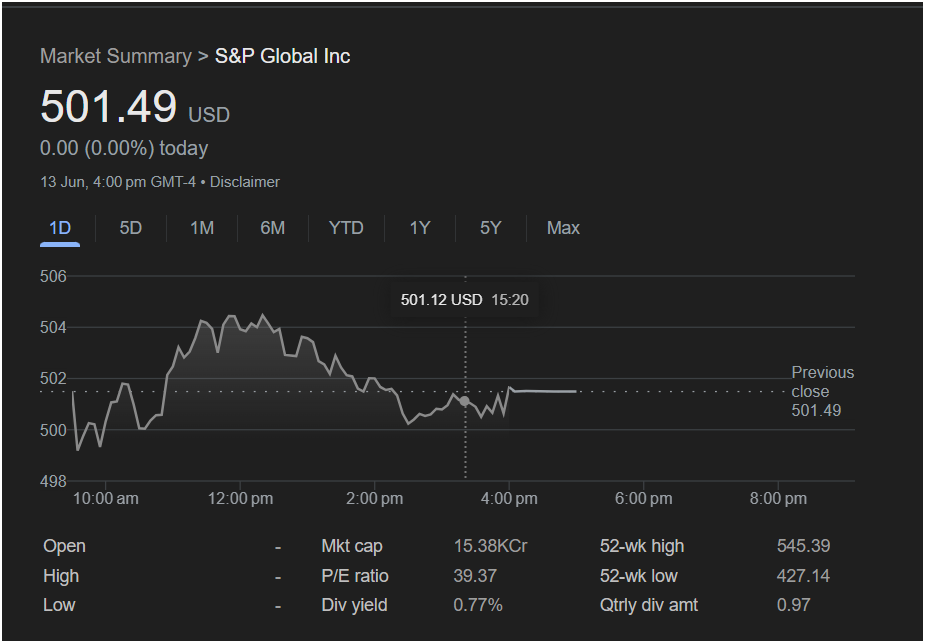
The 1-day chart for S&P Global shows the stock experienced a significant tug-of-war. After opening, it rallied strongly to a high of around $505 before noon. However, sellers took firm control in the afternoon, erasing all gains and pushing the price back down towards the crucial $500 level. A late-session bounce helped the stock recover slightly to settle at its final price. This pattern of a strong rally followed by a complete fade suggests market indecision and sets up a critical test for the stock in the next trading session.
Key Information for Traders:
To make an informed decision on S&P Global stock, traders should consider these key metrics:
-
Previous Closing Price: $501.49
-
52-Week Range: $427.14 – $545.39
-
P/E Ratio: 39.37
-
Dividend Yield: 0.77%
-
Quarterly Dividend Amount: $0.97
 Analysis: Is Now the Time to Invest?
The current state of S&P Global’s stock presents a classic technical puzzle for traders, with clear arguments for both bullish and bearish outlooks.
The Bullish Case: The most significant positive sign is that the stock successfully defended the psychological and technical support level of $500. The bounce from the intraday lows indicates that buyers are willing to step in at this price. For those with a positive outlook, the stock is still trading a considerable distance from its 52-week high of $545.39, suggesting there is ample room for upward movement if positive momentum can be sustained.
The Bearish Case: The primary concern is the stock’s failure to hold its midday highs. The strong rejection at the $505 level indicates that significant selling pressure exists. Furthermore, the stock’s P/E ratio of 39.37 is relatively high. This valuation implies that high growth expectations are already priced into the stock, making it vulnerable to sharp declines if it fails to meet those expectations or if broader market sentiment turns negative. The low dividend yield of 0.77% offers little cushion or appeal for income investors, meaning the stock relies heavily on growth for its appeal.
Outlook for Monday
Monday’s trading session will be pivotal. The key price level to watch is $500.
-
If the stock opens and holds above $501.49, and particularly if it can break through the previous day’s resistance around $505, it would be a strong bullish signal. This could indicate that the consolidation is over and buyers are taking control for a potential run towards higher levels.
-
Conversely, if the stock breaks below the $500 support level, it would be a bearish development. This could trigger further selling and open the door to a retest of lower support zones.
: S&P Global stock is currently in a state of consolidation, and investing today is a bet on which direction it will break. For short-term traders, it may be prudent to wait for a confirmed move above resistance or below support before committing capital. For long-term investors, the high P/E ratio demands confidence in the company’s future growth trajectory, as the stock is priced for performance.


