कैबिनेट में फेरबदल की अटकलों के बीच PM मोदी की 5वीं मीटिंग… जानें किन अहम मुद्दों पर हुई चर्चा…
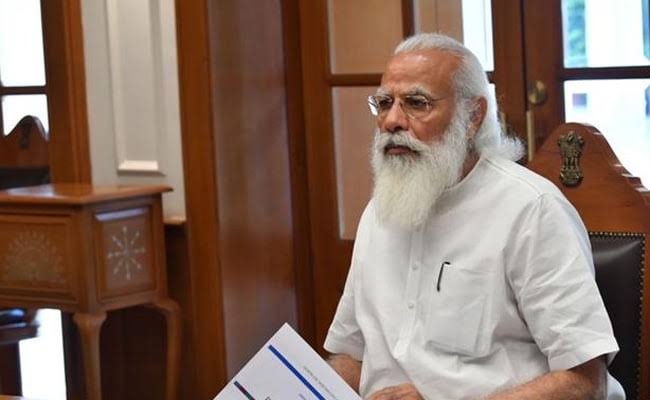
नई दिल्ली. प्रधानमंत्री नरेंद्र मोदी (PM Narendra Modi) ने सोमवार को रक्षा मंत्री राजनाथ सिंह और सड़क, परिवहन और राजमार्ग मंत्री नितिन गडकरी सहित केंद्रीय मंत्रिपरिषद के अन्य सहयोगियों के साथ बैठक की. प्रधानमंत्री आवास पर हुई इस बैठक में भाजपा अध्यक्ष जे पी नड्डा भी मौजूद थे. सूत्रों ने यह जानकारी दी.
सूत्रों के मुताबिक प्रधानमंत्री (PM Narendra Modi) ने पिछले सप्ताह भी इस प्रकार की बैठकें की थीं. उन्होंने बताया कि इन बैठकों के जरिए प्रधानमंत्री विगत दो वर्षों में विभिन्न मंत्रालयों में हुए कामकाज का लेखा जोखा ले रहे हैं और कई मुद्दों पर चर्चा कर रहे हैं.
इसी कड़ी में आज हुई पांचवीं बैठक में राजनाथ सिंह और गडकरी के अलावा केंद्रीय मंत्री डी वी सदानंद गौड़ा और विदेश राज्यमंत्री वी मुरलीधरन सहित कुछ अन्य मंत्री शामिल हुए. सूत्रों ने बताया कि भाजपा अध्यक्ष लगभग इन सभी बैठकों में उपस्थित थे.
पिछले सप्ताह मोदी (PM Narendra Modi) ने केंद्रीय गृह मंत्री अमित शाह, केंद्रीय मंत्री रविशंकर प्रसाद और जितेंद्र सिंह के साथ चर्चा की थी. राजनीतिक पर्यवेक्षकों और भाजपा नेताओं की मानें तो यह केंद्रीय मंत्रिपरिषद में विस्तार और फेरबदल के पहले की प्रक्रिया हो सकती है. सूत्रों का कहना है कि सभी बैठकें लगभग पांच घंटे तक चली हैं.
उन्होंने बताया कि मंत्रालयों के कामकाज की समीक्षा के अलावा प्रधानमंत्री ने इन बैठकों में अन्य महत्वपूर्ण और प्रासंगिक मुद्दों पर भी चर्चा की. मोदी की शीर्ष स्तर पर यह बैठकें ऐसे समय में हुई है जब देश में कोरोना महामारी की दूसरी लहर में संक्रमण के मामलों में कमी आई है. इस लहर के दौरान सरकार को आलोचनाओं का भी सामना करना पड़ा. सूत्रों के मुताबिक, इसी प्रकार की एक बैठक के दौरान प्रधानमंत्री के समक्ष इस बारे में एक प्रस्तुति भी दी गई.
प्रधानमंत्री ने पिछले सप्ताह कृषि, ग्रामीण विकास, पशुपालन और मत्स्य, जनजातीय मामलों, शहरी विकास, संस्कृति, सांख्यिकी और कार्यक्रम क्रियान्वयन, नागरिक उड्डयन, रेलवे, खाद्य और उपभोक्ता मामले, जल शक्ति, पेट्रोलियम, इस्पात और पर्यावरण मंत्रालयों के केंद्रीय और राज्यमंत्रियों के साथ चर्चा की थी.
ज्ञात हो कि पिछले दिनों नड्डा और भाजपा के संगठन महासचिव बी एल संतोष ने कोविड-19 की दूसरी लहर से पैदा हुई परिस्थितियों और हाल ही में संपन्न हुए विधानसभा चुनावों में पार्टी के प्रदर्शन को लेकर पार्टी महासचिवों और विभिन्न मोर्चों के अध्यक्षों के साथ दो दिनों तक मंथन किया और इसके बाद नड्डा ने सभी नेताओं के साथ प्रधानमंत्री से मुलाकात की थी.
2022 में सात राज्यों के विधानसभा चुनाव
अगले साल की शुरुआत में उत्तर प्रदेश, उत्तराखंड, पंजाब, मणिपुर और गोवा सहित पांच राज्यों में विधानसभा के चुनाव होने हैं. इन चुनावों में पार्टी के बेहतर प्रदर्शन को लेकर भाजपा का शीर्ष नेतृत्व अपनी तैयारियों में जुट गया है, इन पांच में से चार राज्यों में भाजपा का शासन है, जबकि पंजाब कांग्रेस शासित है. इन पांच राज्यों के बाद साल के अंत में गुजरात और हिमाचल प्रदेश के भी विधानसभा चुनाव होने हैं. इन सभी राज्यों में भाजपा के सामने अपनी सरकार बचाने की चुनौती होगी. हालांकि, मंत्रिपरिषद में विस्तार या फेरबदल को लेकर आधिकारिक तौर पर कोई बयान सामने नहीं आया है, लेकिन पिछले कुछ दिनों से इसको लेकर अटकलें लगाई जा रही हैं.


