पटना. अपने बेरोजगार पति को फर्जी आईपीएस अधिकारी बनाकर पुलिस वर्दी पहनाने वाली बिहार की महिला डीएसपी पर आखिरकार शिकंजा कस ही गया. सरकार ने अपनी जांच में महिला डीएसपी के खिलाफ लगे आरोपों को सही पाया है. जांच पूरी होने के बाद महिला पुलिस अधिकारी के खिलाफ विभागीय कार्रवाई करने का आदेश जारी कर दिया गया है.
बता दें कि वर्ष 2021 में यह मामला सामने आया था. भागलपुर में अनुमंडल पुलिस पदाधिकारी के पद पर तैनात डीएसपी रेशु कृष्णा पर अपने पति को फर्जी आईपीएस बनाने का आरोप लगा था. रेशु कृष्णा ने अपने पति को आईपीएस की वर्दी पहना कर साथ में फोटो खिंचवाई और उसे सोशल मीडिया में पोस्ट भी कर दिया था. इस मामले की शिकायत सीधे प्रधानमंत्री नरेंद्र मोदी के कार्यालय तक पहुंच गई थी. इसके बाद बिहार सरकार ने भी मामले की छानबीन अपने स्तर पर शुरू कर दी थी.
दरअसल, ये मामला 2021 के अगस्त में ही सामने आया था. मामला गंभीर था. डीएसपी जैसे गंभीर पद पर तैनात महिला अधिकारी ने अपने पति को ही फर्जी आईपीएस अधिकारी बना दिया था. डीएसपी के कारनामों की बिहार डीजीपी एस के सिंघल ने जांच कर रिपोर्ट सरकार को भेजी थी. डीजीपी ने पिछले साल ही 3 दिसंबर को ही अपनी रिपोर्ट सरकार को भेज दी थी.
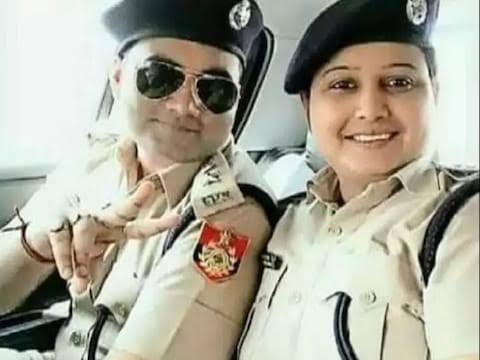
जांच रिपोर्ट में स्पष्ट था कि कहलगांव की तत्कालीन अनुमंडल पुलिस पदाधिकारी रेशु कृष्णा ने अपने सरकारी मोबाइल नंबर के वाट्सएप और दूसरे सोशल मीडिया प्लेटफार्म पर अपने पति सौरभ कुमार के साथ फोटो डाले थे. इन फोटो में सौरभ कुमार आईपीएस अधिकारी की वर्दी में था. हकीकत में सौरभ कुमार न तो पुलिस अधिकारी या कर्मचारी है; और ना ही भारतीय पुलिस सेवा यानि IPS का पदाधिकारी है. लेकिन, डीएसपी रेशु कृष्णा ने अपने पति सौरभ कुमार के साथ जो तस्वीर सोशल मीडिया पर लगाया था उसमें सौरभ वर्दी पहने थे. इस पर दिल्ली पुलिस का प्रतीक चिह्न और आईपीएस का बैच लगा था.
जांच में पता चला था कि कहलगांव के अनुमंडल पुलिस पदाधिकारी पद पर तैनाती के दौरान रेशु कृष्णा ने अपने क्षेत्र के ही कई स्थानों पति सौरभ कुमार के साथ ऐसी तस्वीरें खिंचवाई और उसे सोशल मीडिया में वायरल कर दिया था. बिहार सरकार के गृह विभाग की ओर से जारी हुए पत्र में कहा गया है कि जांच में डीएसपी रेशु कृष्णा पर अपने पति को फर्जी वर्दी पहनाकर साथ में फोटो खिंचवाने, आईपीएस की फर्जी वर्दी पहने पति के साथ मंदिर में पूजा करने, ऐसी तस्वीरों को सोशल मीडिया में वायरल करने का आरोप सही पाया गया है.