Advanced Micro Devices Inc. (AMD) stock is shaping up for a dynamic start to the trading week after a volatile session ended in a rare stalemate. A significant surge in pre-market activity has shifted the sentiment to bullish, and traders are now watching to see if AMD has the power to break through key resistance levels.
A Day of Indecision Sets the Stage
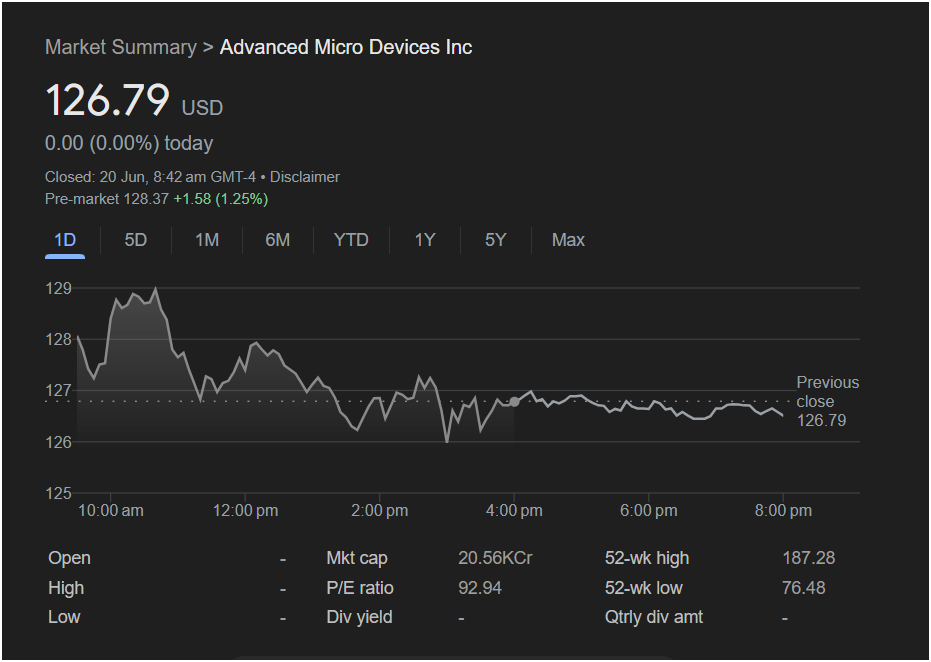
The market data from Thursday, June 20th, shows AMD stock closing at 126.79 USD, remarkably unchanged for the day with a 0.00% move. This flat close, however, belies the significant volatility that occurred during the session.
The day began with a burst of buying, pushing the stock to a session high of approximately
126. For the remainder of the day, AMD was locked in a tight battle, consolidating in a narrow range mostly between $126.50 and $127.50. The fact that the stock closed exactly where it started indicates a perfect equilibrium between buying and selling pressure—a market coiled with potential energy.
The most critical piece of information for Monday’s outlook is the pre-market activity. As of Friday morning, AMD stock was trading at $128.37, a strong gain of +1.58 (1.25%). This suggests that buyers have gained the upper hand since Thursday’s close.
Key Trading Metrics at a Glance
For traders preparing for Monday’s session, these metrics are crucial:
-
Closing Price: 126.79 USD
-
Day’s Change: 0.00 (0.00%)
-
Pre-Market Price: 128.37 (+1.25%)
-
Session High (approx.): $129.00
-
Session Low (approx.): $126.00
-
52-Week High: 187.28
-
52-Week Low: 76.48
-
P/E Ratio: 92.94
AMD’s high P/E ratio reflects investor expectations for future growth, making the stock highly sensitive to shifts in market sentiment.
Outlook: Is it Time to Invest in AMD?
Disclaimer: This article is an analysis of past performance and technical indicators. It is not financial advice. Investing in the stock market carries risks, and you should conduct your own research or consult a financial advisor before making any investment decisions.
The pre-market jump has set a clear bullish tone for Monday. Here’s how traders might interpret the setup.
The Bullish Case (Potential for the Stock to Go Up):
The strong pre-market move to
129. A decisive break above $129 would signal that the bulls are in full control and could spark a move towards the next psychological level of $130 and beyond.
The Bearish Case (The “Gap and Fade” Scenario):
Bears will be watching to see if this pre-market strength is a “bull trap.” Often, stocks can gap up at the open only to see sellers come in and push the price back down, a pattern known as a “gap and fade.” If AMD opens high but fails to break above the
128.37, it would be a sign of weakness. A drop back into Thursday’s trading range, particularly below $127, would suggest the bullish move has failed.
for Traders
Monday’s session for AMD will be defined by its reaction to the pre-market surge.
-
Key Resistance: $129.00. This is the most important level for bulls to conquer.
-
Key Support:
127.00 (top of Thursday’s consolidation).
-
For Bullish Traders: The setup is favorable. Watch for a strong open that holds above $128, followed by a push through $129. This would be a clear signal to trade the upward momentum.
-
For Cautious/Bearish Traders: Wait to see if the initial strength fades. If the stock opens high and then starts to sell off, failing to hold the $128 level, it could present a shorting opportunity.
The bullish pre-market action has given AMD a significant advantage, but the first hour of trading on Monday will be crucial to confirm whether this is the start of a new leg up or just temporary excitement.